Robotics System Toolbox学习笔记(七):轨迹规划的函数
文章目录
- bsplinepolytraj
- cubicpolytraj
- quinticpolytraj
- rottraj
- transformtraj
- trapveltraj
- 参考
bsplinepolytraj
使用b样条生成多项式轨迹。
 % 生成一个分段三次b样条轨迹
 % 	control points---表示一组二维xy控制点,控制点构成直线段多边形,b样条根据这些控制点生成多边形对应的曲线
 % 	tInterVal---起始时间
 % 	tSamples---按照一定周期构成的时间样本
[q,qd,qdd,pp] = bsplinepolytraj(control points,tInterval,tSamples);
该函数输出轨迹位置(q)、速度(qd)、加速度(qdd)、时间矢量(tvec)和多项式系数(pp),多项式利用梯形速度实现路径点。
%lesson_10_bsplinepolytraj 使用b样条生成多项式轨迹
% [q,qd,qdd,pp] = bsplinepolytraj(control points,tInterval,tSamples)生成一个分段三次b样条轨迹,
% 该轨迹落在由控制点定义的控制多边形中。在tInterval中给定的起始时间和结束时间之间对弹道进行均匀采样。
% 函数返回输入时间样本tSamples的位置、速度和加速度。该函数还返回多项式轨迹关于时间的分段多项式pp形式。

%使用bsplinepolytraj函数指定一组二维xy控制点。b样条使用这些控制点在多边形内创建轨迹。还给出了路点的时间点。

cpts = [1 4 4 3 -2 0; 0 1 2 4 3 1];
tpts = [0 5];

%计算b样条轨迹

tvec = 0:0.01:5;
[q, qd, qdd, pp] = bsplinepolytraj(cpts,tpts,tvec);

figure
plot(cpts(1,:),cpts(2,:),'xb-')
hold all
plot(q(1,:), q(2,:))
xlabel('X')
ylabel('Y')
hold off

%绘制b样条轨迹中每个元素的位置。这些轨迹是在时间上参数化的三次分段多项式。

figure
plot(tvec,q)
hold all
plot([0:length(cpts)-1],cpts,'x')
xlabel('t')
ylabel('Position Value')
legend('X-positions','Y-positions')
hold off
cubicpolytraj
生成三阶多项式轨迹。
[q,qd,qdd,pp] = polytraj(wayPoints,timePoints,tSamples)
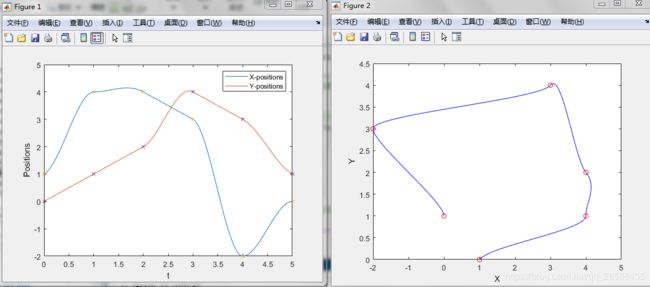
生成一个三阶多项式,该多项式实现一组给定的输入waypoint和相应的时间点。
该函数输出给定时间样本tSamples的位置q、速度qd和加速度qdd。该函数还返回多项式轨迹关于时间的分段多项式pp形式。
wpts = [1 4 4 3 -2 0; 0 1 2 4 3 1];
tpts = 0:5;
tvec = 0:0.01:5;
% 每个航路点的速度边界条件,指定为由“ VelocityBoundaryCondition”和n×p矩阵组成的逗号分隔对。
% 每行对应于轨迹中各个变量在所有p个航路点的速度
[q, qd, qdd, pp] = cubicpolytraj(wpts, tpts, tvec, 'VelocityBoundaryCondition',[1 0 -1 -1 0 0; 1 1 1 -1 -1 -1]);
plot(tvec, q)
hold all
plot(tpts, wpts, 'x')
xlabel('t')
ylabel('Positions')
legend('X-positions','Y-positions')
hold off
%您还可以验证二维平面中的实际位置。将q向量和路径点的单独行绘制为x和y位置。
figure
plot(q(1,:),q(2,:),'-b',wpts(1,:),wpts(2,:),'or')
xlabel('X')
ylabel('Y')
quinticpolytraj
生成五阶多项式轨迹。
[q, qd, qdd, pp] = quinticpolytraj(wayPoints,timePoints,tSamples)
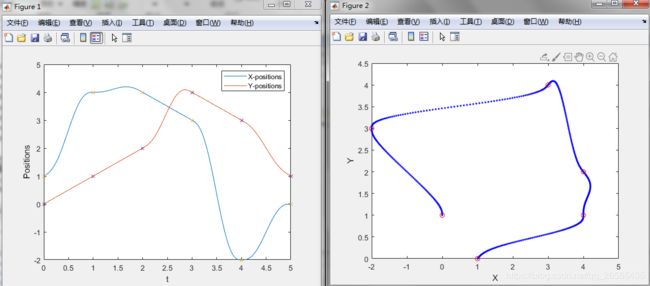
生成一个五阶多项式,该多项式实现一组给定的输入wayPoints和相应的时间点。
该函数输出给定时间样本tSamples的位置、速度和加速度。该函数还返回多项式轨迹关于时间的分段多项式pp形式。
wpts = [1 4 4 3 -2 0; 0 1 2 4 3 1];
tpts = 0:5;
tvec = 0:0.01:5;
% 每个航路点的速度边界条件,指定为由“ VelocityBoundaryCondition”和n×p矩阵组成的逗号分隔对。
% 每行对应于轨迹中各个变量在所有p个航路点的速度
[q, qd, qdd, pp] = quinticpolytraj(wpts, tpts, tvec,'VelocityBoundaryCondition',[1 0 -1 -1 0 0; 1 1 1 -1 -1 -1]);
plot(tvec, q)
hold all
plot(tpts, wpts, 'x')
xlabel('t')
ylabel('Positions')
legend('X-positions','Y-positions')
hold off

figure
plot(q(1,:),q(2,:),'.b',wpts(1,:),wpts(2,:),'or')
xlabel('X')
ylabel('Y')
rottraj
生成方向旋转矩阵之间的轨迹。
[R,omega,alpha] = rottraj(r0,rF,tInterval,tSamples)
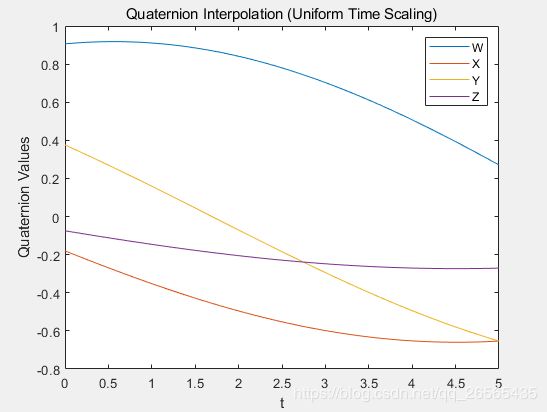
生成一个轨迹,该轨迹在r0和rF两个方向之间插入点,这些点基于时间间隔和给定的时间样本。
%定义两个四元数路径点在它们之间插入。

q0 = quaternion([0 pi/4 -pi/8],'euler','ZYX','point');
qF = quaternion([3*pi/2 0 -3*pi/4],'euler','ZYX','point');

tvec = 0:0.01:5;

%w方向角速度,方向角加速度
[qInterp1,w1,a1] = rottraj(q0,qF,[0 5],tvec);

plot(tvec,compact(qInterp1))
title('Quaternion Interpolation (Uniform Time Scaling)')
xlabel('t')
ylabel('Quaternion Values')
legend('W','X','Y','Z')

%在旋转矩阵之间插入轨迹
r0 = [1 0 0; 0 1 0; 0 0 1];
rF = [0 0 1; 1 0 0; 0 0 0];
tvec = 0:0.1:1;
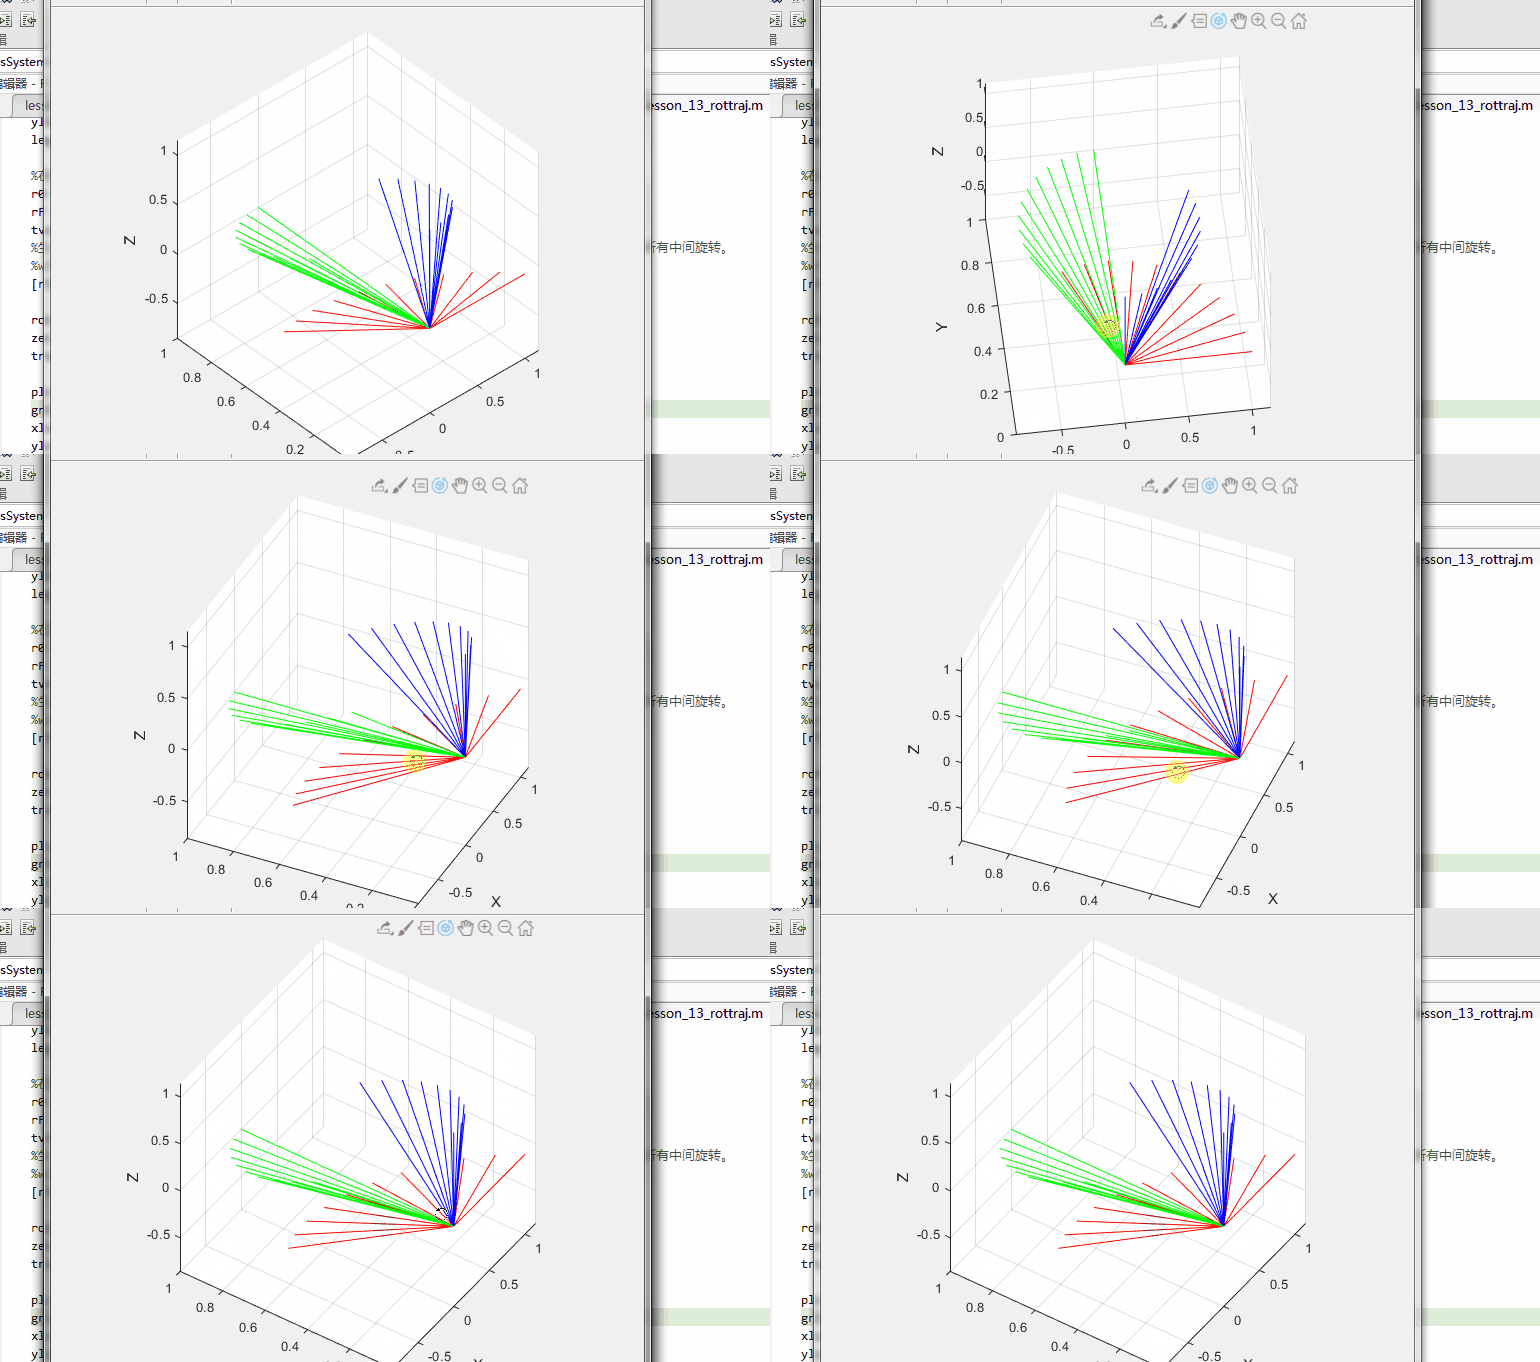
%生成轨迹。使用plotTransforms绘制结果。将旋转矩阵转换为四元数并指定零平移。图中显示了坐标系的所有中间旋转。
%w方向角速度,方向角加速度
[rInterp1,w1,a1] = rottraj(r0,rF,[0 1],tvec);

rotations = rotm2quat(rInterp1);
zeroVect = zeros(length(rotations),1);
translations = [zeroVect,zeroVect,zeroVect];

plotTransforms(translations,rotations)
xlabel('X')
ylabel('Y')
zlabel('Z')
transformtraj
生成两个齐次矩阵之间的轨迹。
[tforms,vel,acc] = transformtraj(T0,TF,tInterval,tSamples)
生成一个轨迹,该轨迹在两个4×4的齐次变换T0和TF之间插入,其中的点基于时间间隔tInterval和给定的时间样本tSamples。
% 从两个方向和位置构建转换。给出了插值的时间间隔和时间矢量。
% axang2tform---轴角转换为齐次变换矩阵
t0 = axang2tform([0 1 1 pi/4])*trvec2tform([0 0 0]);
tF = axang2tform([1 0 1 6*pi/5])*trvec2tform([1 1 1]);
tInterval = [0 1];
tvec = 0:0.01:1;

% 在点之间插入。使用plotTransforms绘制轨迹。将转换转换为四元数旋转和线性转换。图中显示了坐标系的所有中间变换。

[tfInterp, v1, a1] = transformtraj(t0,tF,tInterval,tvec);

rotations = tform2quat(tfInterp);
translations = tform2trvec(tfInterp);

plotTransforms(translations,rotations)
xlabel('X')
ylabel('Y')
zlabel('Z')
trapveltraj
生成带有梯形速度剖面的轨迹。
[q,qd,qdd,tSamples,pp] = trapveltraj(wayPoints,numSamples)
通过给定的一组遵循梯形速度剖面的输入wayPoints生成轨迹。该函数输出给定时间内的位置q、速度qd和加速度qdd。该函数还返回多项式轨迹关于时间的分段多项式pp形式。
wpts = [0 45 15 90 45; 90 45 -45 15 90];
[q, qd, qdd, tvec, pp] = trapveltraj(wpts, 501);

subplot(2,1,1)
plot(tvec, q)
xlabel('t')
ylabel('Positions')
legend('X','Y')
subplot(2,1,2)
plot(tvec, qd)
xlabel('t')
ylabel('Velocities')
legend('X','Y')

%您还可以验证二维平面中的实际位置。将q向量和路径点的单独行绘制为x和y位置。
figure
plot(q(1,:),q(2,:),'-b',wpts(1,:),wpts(2,:),'or')
参考
Trajectory Generation and Following


