echarts选项卡切换效果,并且自适应随着窗口大小变大变小。

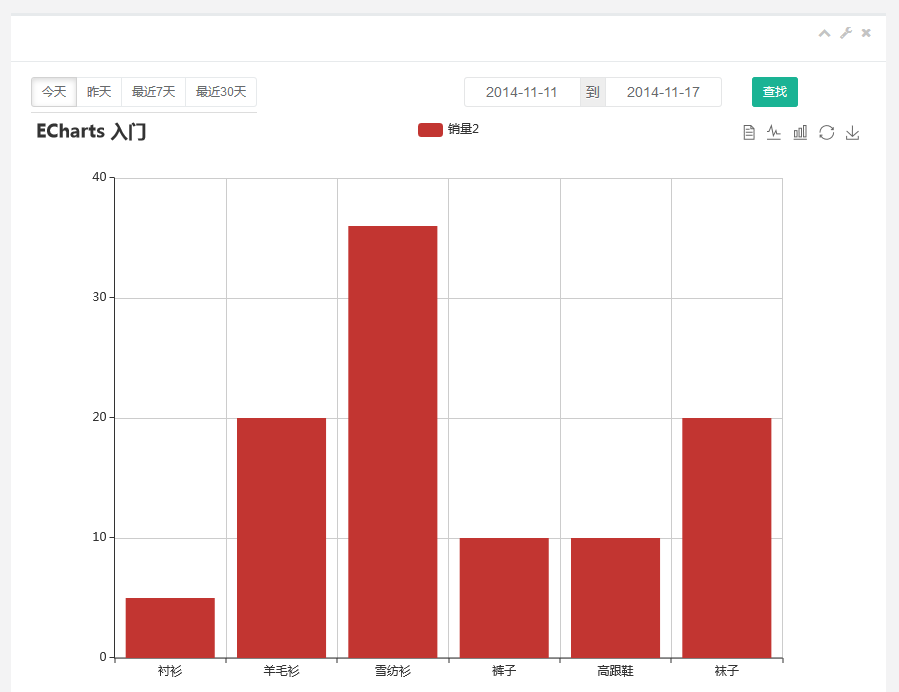
首先先来个效果图:
echarts选项卡切换效果,并且自适应随着窗口大小变大变小。_第1张图片
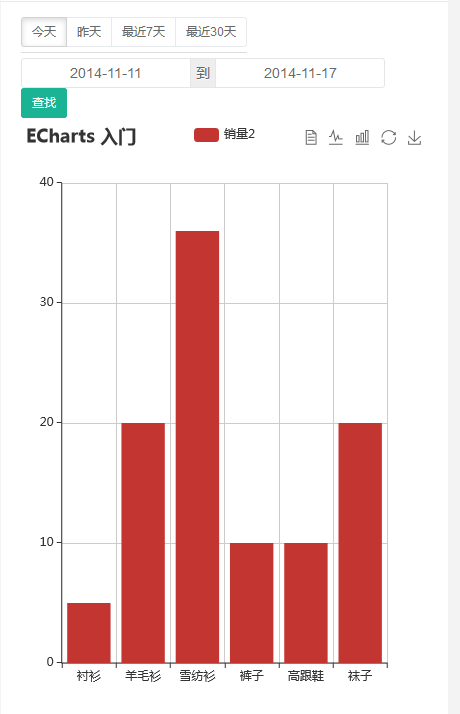
这个是缩小后的窗口:
echarts选项卡切换效果,并且自适应随着窗口大小变大变小。_第2张图片
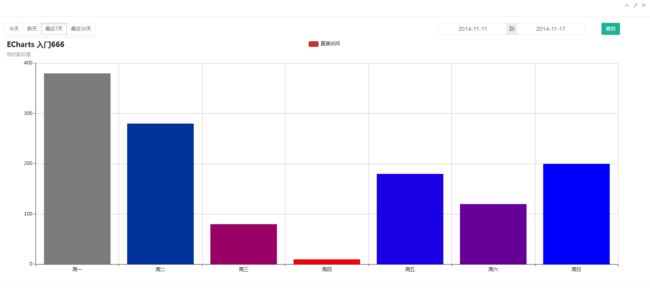
echarts选项卡切换效果,并且自适应随着窗口大小变大变小。_第3张图片
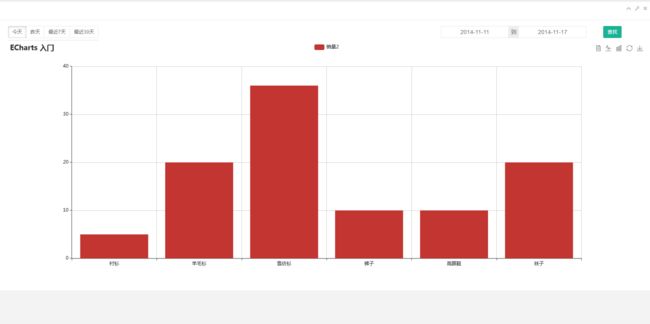
切换效果:
echarts选项卡切换效果,并且自适应随着窗口大小变大变小。_第4张图片
下面是代码:我用的是echarts3.0的,首先要去官网把echarts.min.js下载下来
我写的是bootstrap的网页
HTML:

 <div class="row">
            <div class="col-lg-12">
                <div class="wrapper wrapper-content animated fadeInUp">

                    <div class="ibox float-e-margins">
                        <div class="ibox-title" style="padding: 7px 15px 7px;">
                            <div class="ibox-tools" >
                                class="collapse-link">
                                    class="fa fa-chevron-up">
                                
                                class="dropdown-toggle" data-toggle="dropdown" href="#">
                                    class="fa fa-wrench">
                                
                                
                                class="close-link">
                                    class="fa fa-times">
                                
                            div>
                        div>
                        <div class="ibox-content table-responsive">
                            <div class="row">
                                <div class="col-lg-8 col-sm-6 m-b-xs">
                                    <div data-toggle="buttons" class="btn-group nav-tabs">


                                div>
                                <div class="col-lg-3 col-sm-4">
                                    <div class="input-daterange input-group" id="datepicker">
                                        "text" class="input-sm form-control data1" name="start" value="2014-11-11" />
                                        class="input-group-addon">到
                                        "text" class="input-sm form-control data1" name="end" value="2014-11-17" />
                                    div>
                                div>
                                <div class="col-lg-1 col-sm-2">
                                    
                                div>
                            div>
                            <div class="ctab cbody tab-content">
                                <div class="ctab content " id="mycharts" style="height: 600px;" >
                                    Tab Content 1
                                div>
                                <div class="ctab content active" id="charts2" style="display: none;height: 600px;">
                                    Tab Content 2
                                div>
                                <div class="ctab content " id="charts3" style="display: none;height: 600px;">
                                    Tab Content 3
                                div>
                                <div class="ctab content " id="charts4" style="display:none;height: 600px;">
                                    Tab Content 4
                                div>
                            div>
                        div>
                    div>
                div>
            div>
        div>

下面是JS代码
我用的是echarts3.0的,首先要去官网把echarts.min.js下载下来
要注意html 今天昨天最近7天最近30天里要加data-target=”0”data-target=”1”….这些

    <script src="js/jquery-2.1.1.js">script>
        <script src="js/bootstrap.min.js">script>
        <script src="js/echarts.min.js">script>

   <script>
            var charts = [];
            var opts = [{
                title: {
                    text: 'ECharts 入门'
                },
                tooltip: {},
                legend: {
                    data: ['销量2']
                },
                toolbox: {
                    show : true,
                    feature : {
                        mark : {show: true},
                        dataView : {show: true, readOnly: false},
                        magicType : {show: true, type: ['line', 'bar']},
                        restore : {show: true},
                        saveAsImage : {show: true}
                    }
                },
                xAxis: {
                    data: ["衬衫", "羊毛衫", "雪纺衫", "裤子", "高跟鞋", "袜子"]
                },
                yAxis: {},
                series: [{
                    name: '销量2',
                    type: 'bar',
                    data: [5, 20, 36, 10, 10, 20]
                }]
            },{
                title: {
                    text: 'ECharts 入门2'
                },
                tooltip: {},
                legend: {
                    data: ['销量2']
                },
                xAxis: {
                    data: ["衬衫", "羊毛衫", "雪纺衫", "裤子", "高跟鞋", "袜子"]
                },
                yAxis: {},
                series: [{
                    name: '销量2',
                    type: 'bar',
                    data: [5, 20, 36, 10, 10, 20]
                }]
            },{
                title: {
                    text: 'ECharts 入门666',
                    color:'red',
                    fontSize:'24px',
                    subtext:'我的副标题'
                },
                tooltip : {
                    trigger: 'axis',
                    axisPointer : {            // 坐标轴指示器,坐标轴触发有效
                        type : 'shadow'        // 默认为直线,可选为:'line' | 'shadow'
                    }
                },
                legend: {
                    data:['直接访问','邮件营销','联盟广告','视频广告','搜索引擎','百度','谷歌','必应','其他']
                },
                grid: {
                    left: '3%',
                    right: '4%',
                    bottom: '3%',
                    containLabel: true
                },
                xAxis : [
                    {
                        type : 'category',
                        data : ['周一','周二','周三','周四','周五','周六','周日']
                    }
                ],
                yAxis : [
                    {
                        type : 'value'
                    }
                ],
                visualMap: {
                    show:false,
                    min: 0,
                    max: 400,
                    range: [0, 370],
                    inRange: {color: ['red', 'blue', 'green']},
                    outOfRange: {
                        color: ['red', 'rgba(3,4,5,0.4)', 'gray'],
                        symbolSize: [30, 100]
                    }
                },
                series : [
                    {
                        name:'直接访问',
                        type:'bar',
                        data:[{name:'周一',value:380}, {name:'周二',value:280}, {name:'周二',value:80}, {name:'周二',value:10},
                            {name:'周二',value:180}, {name:'周二',value:120}, {name:'周二',value:200}]
                    }
                ]
            },{
                title: {
                    text: 'ECharts 入门3'
                },
                tooltip: {},
                legend: {
                    data: ['销量2']
                },
                xAxis: {
                    data: ["衬衫", "羊毛衫", "雪纺衫", "裤子", "高跟鞋", "袜子"]
                },
                yAxis: {},
                series: [{
                    name: '销量2',
                    type: 'bar',
                    data: [5, 20, 36, 10, 10, 20]
                }]
            },{
                title: {
                    text: 'ECharts 入门4'
                },
                tooltip: {},
                legend: {
                    data: ['销量2']
                },
                xAxis: {
                    data: ["衬衫", "羊毛衫", "雪纺衫", "裤子", "高跟鞋", "袜子"]
                },
                yAxis: {},
                series: [{
                    name: '销量2',
                    type: 'bar',
                    data: [5, 20, 36, 10, 10, 20]
                }]
            }];

下面这个是控制选项卡和自适应效果的JS

    $(function(){
                $(".cbody>.content:gt(0)").hide();
                $(".nav-tabs ").delegate('label','click',function(e){
                    if($(this).hasClass("active")){
                        return;
                    }
                    $(this).addClass('active').siblings('label').removeClass("active");
                    var index=$(this).data('target');
                    $('.cbody>.content:eq('+index+')').show(function(){
                        charts[index].setOption(opts[index]);
                        charts[index].resize();
                    }).siblings().hide();

                });
                $(".cbody>.content").each(function(){
                    charts.push(echarts.init($(this).get(0)));
                });
                charts[0].setOption(opts[0]);
            });
            $(window).resize(function(){
                $(charts).each(function(index, chart){
                    chart.resize();
                });
            });

我写的这个是静态的echarts 还要动态的,还在弄~弄好了贴出来,一起学习。

你可能感兴趣的:(个人日记)