python可视化:pyplot各种图形样例
1.使用 plt.plot() 画 折线图
函数格式:
格式1:plt.plot([x], y, [fmt], data=None, **kwargs)
格式2:plt.plot([x], y, [fmt], [x2], y2, [fmt2], ..., **kwargs)
参数说明:
fmt = '[color][marker][line]'**kwargs:
In [78]:
import numpy as np

import matplotlib.pyplot as plt

x = np.arange(20)

y = x**2

fmt = 'r-'

plt.plot(x,y,fmt,label='y=x^2')

plt.xlabel('x') #x轴的名字

plt.ylabel('y') #y轴的名字

plt.legend() #在图区显示label

plt.show()
In [77]:
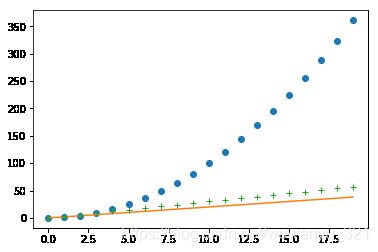
import numpy as np

import matplotlib.pyplot as plt

x = np.arange(20)

plt.plot(x,x**2,'o',

x,2*x,'-',

x,3*x,'+'

)

plt.show()
In [76]:
import numpy as np

import matplotlib.pyplot as plt

x = np.arange(20)

y1 = x**2

y2 = x*2

y3 = x*3

plt.plot(x, y1, '^', label='y=x^2')

plt.plot(x, y2, '1', label='y=x*2')

plt.plot(x, y3, '*', label='y=x*3')

plt.legend()

plt.show()
2. 使用 plt.bar() 画 条形图
函数格式: plt.bar( ['x', 'height', 'width=0.8', 'bottom=None', '', "align='center'", 'data=None', '*kwargs'], )
In [75]:
import numpy as np

import matplotlib.pyplot as plt

x = np.arange(20)

y = 2*x

plt.bar(x,y,label="y=2*x")

plt.legend()
Out[75]:
3. 使用 plt.hist() 画 直方图
函数格式:plt.hist( ['x', 'bins=None', 'range=None', 'density=None', 'weights=None', 'cumulative=False', 'bottom=None', "histtype='bar'", "align='mid'", "orientation='vertical'", 'rwidth=None', 'log=False', 'color=None', 'label=None', 'stacked=False', 'normed=None', '', 'data=None', '*kwargs'], )
In [74]:
import matplotlib.pyplot as plt

x = [1,2,2,3,3,3,4]

plt.hist(x,label='hist',color='g')

plt.legend()

plt.show()
4. 使用 plt.scatter() 画 散点图
函数格式:plt.scatter( ['x', 'y', 's=None', 'c=None', 'marker=None', 'cmap=None', 'norm=None', 'vmin=None', 'vmax=None', 'alpha=None', 'linewidths=None', 'verts=None', 'edgecolors=None', '', 'data=None', '*kwargs'], )
说明 :
s : scalar or array_like, shape (n, ), optional The marker size in points*2. Default is rcParams['lines.markersize'] * 2.
c : color, sequence, or sequence of color, optional
In [73]:
import numpy as np

import matplotlib.pyplot as plt

x = np.arange(10)

y=2*x

scalar = x**2

color = x

plt.scatter(x, y, scalar , color , 'o', label="y = 2*x")

plt.legend()

plt.show()
In [72]:
import numpy as np

import matplotlib.pyplot as plt

N=300

x = np.random.randn(N)

y1 = np.random.randn(N)

y2 = y1*2

plt.scatter(x,y1,label="random")

plt.scatter(x,y2,label="random2")

plt.legend()

plt.show()
5. 使用 plt.pie() 画 饼状图
函数格式:plt.pie( ['x', 'explode=None', 'labels=None', 'colors=None', 'autopct=None', 'pctdistance=0.6', 'shadow=False', 'labeldistance=1.1', 'startangle=None', 'radius=None', 'counterclock=True', 'wedgeprops=None', 'textprops=None', 'center=(0, 0)', 'frame=False', 'rotatelabels=False', '*', 'data=None'], )
explode:(每一块)离开中心距离,数据格式。
In [70]:
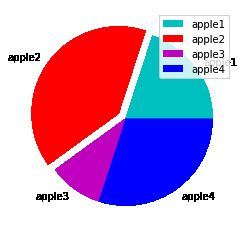
import matplotlib.pyplot as plt

x = [0.2,0.4,0.1,0.3]

explode=(0,0.1,0,0)

labels = ['apple1','apple2','apple3','apple4']

colors= ['c','r','m','b']

plt.pie(x,explode,labels=labels,colors=colors)

plt.legend()

plt.show()
6. 使用 plt.stackplot() 画 堆叠图
函数格式:plt.stackplot(x, args, data=None, *kwargs)
格式1:stackplot(x, y) # where y is MxN
格式2:stackplot(x, y1, y2, y3, y4) # where y1, y2, y3, y4, are all 1xNm
*args:
x : 1d array of dimension N
y : 2d array (dimension MxN), or sequence of 1d arrays (each dimension 1xN)
baseline : {'zero', 'sym', 'wiggle', 'weighted_wiggle'}
labels : Length N sequence of strings
colors : Length N sequence of colors
In [71]:
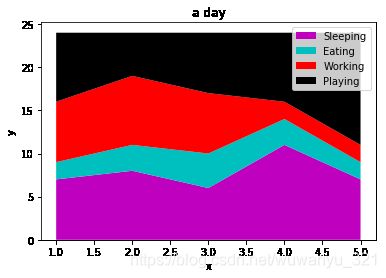
import matplotlib.pyplot as plt

days = [1,2,3,4,5]

sleeping = [7,8,6,11,7]

eating = [2,3,4,3,2]

working = [7,8,7,2,2]

playing = [8,5,7,8,13]

color = ['m','c','r','k']

labels = ['Sleeping','Eating','Working','Playing']

plt.stackplot(days, sleeping,eating,working,playing, colors=color ,labels=labels)

plt.xlabel('x')

plt.ylabel('y')

plt.title('a day')

plt.legend()

plt.show()


