Openlayers6 Examples学习笔记(1)
文章目录
- Bing Maps
- Image ArcGIS MapServer
- Attributions
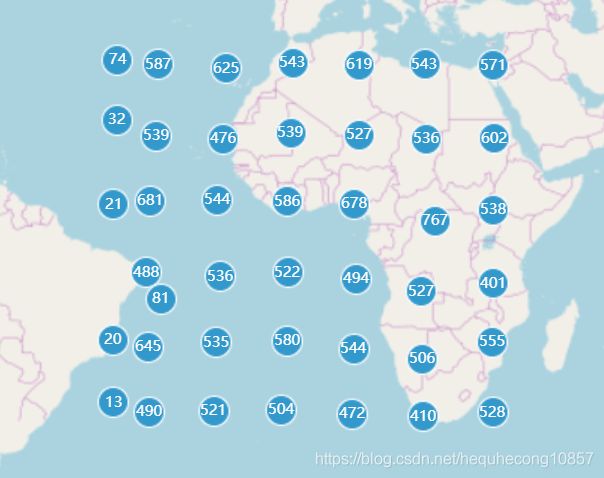
- Clustered Features
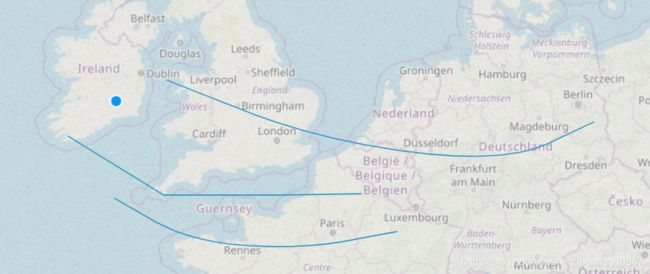
- Smoothing lines using Chaikins algorithm
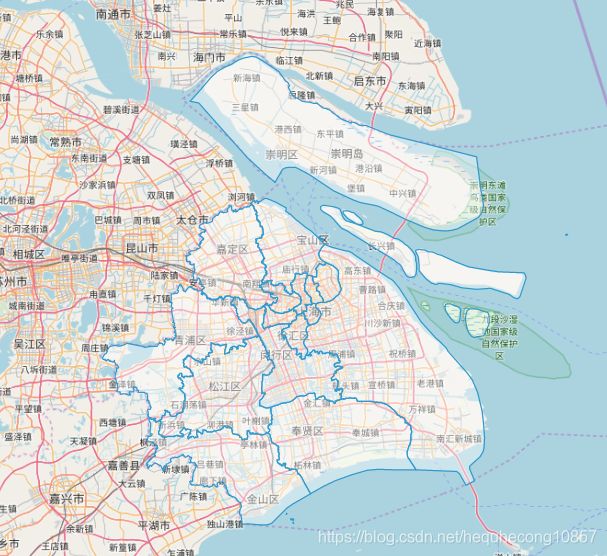
- Drag-and-Drop Image Vector
Bing Maps
笔记:
- 通过Map实例的layers属性,一次性加载多个图层,默认设为visible为false
- 通过TileLayer实例的setVisible()方法来动态控制某个图层的显示
- TileLayer实例的preload属性表示预加载,默认值为0
代码:
import 'ol/ol.css';
import Map from 'ol/Map';
import View from 'ol/View';
import TileLayer from 'ol/layer/Tile';
import BingMaps from 'ol/source/BingMaps';

var styles = [
  'RoadOnDemand',
  'Aerial',
  'AerialWithLabelsOnDemand',
  'CanvasDark',
  'OrdnanceSurvey'
];
var layers = [];
var i, ii;
for (i = 0, ii = styles.length; i < ii; ++i) {
  layers.push(new TileLayer({
    visible: false,
    // 预加载
    preload: Infinity,
    source: new BingMaps({
      key: 'AgUFo_v6f0QeqzznIRw2TQ48DYBlM4ni9F7E-C1fgvQh7IsJ5b59Fe9OGKZBU6qc',
      imagerySet: styles[i]
      // use maxZoom 19 to see stretched tiles instead of the BingMaps
      // "no photos at this zoom level" tiles
      // maxZoom: 19
    })
  }));
}
var map = new Map({
  layers: layers,
  target: 'map',
  view: new View({
    center: [-6655.5402445057125, 6709968.258934638],
    zoom: 13
  })
});

var select = document.getElementById('layer-select');
function onChange() {
  var style = select.value;
  for (var i = 0, ii = layers.length; i < ii; ++i) {
    layers[i].setVisible(styles[i] === style);
  }
}
select.addEventListener('change', onChange);
onChange();
Image ArcGIS MapServer
笔记:
加载ArcGIS Server发布的Image地图服务
import 'ol/ol.css';
import Map from 'ol/Map';
import View from 'ol/View';
import {Tile as TileLayer, Image as ImageLayer} from 'ol/layer';
import {OSM, ImageArcGISRest} from 'ol/source';

var url = 'https://sampleserver1.arcgisonline.com/ArcGIS/rest/services/' +
    'Specialty/ESRI_StateCityHighway_USA/MapServer';

var layers = [
  new TileLayer({
    source: new OSM()
  }),
  new ImageLayer({
    source: new ImageArcGISRest({
      ratio: 1,
      params: {},
      url: url
    })
  })
];
var map = new Map({
  layers: layers,
  target: 'map',
  view: new View({
    center: [-10997148, 4569099],
    zoom: 4
  })
});
Attributions
- 设置属性控件默认展开
- 通过Attribution实例的setCollapsible()和setCollapsed()方法设置属性控件的可展开性和展开的状态
import 'ol/ol.css';
import Map from 'ol/Map';
import View from 'ol/View';
import {defaults as defaultControls, Attribution} from 'ol/control';
import TileLayer from 'ol/layer/Tile';
import OSM from 'ol/source/OSM';

var attribution = new Attribution({
  collapsible: false
});
var map = new Map({
  layers: [
    new TileLayer({
      source: new OSM()
    })
  ],
  controls: defaultControls({attribution: false}).extend([attribution]),
  target: 'map',
  view: new View({
    center: [0, 0],
    zoom: 2
  })
});

function checkSize() {
  var small = map.getSize()[0] < 600;
  attribution.setCollapsible(small);
  attribution.setCollapsed(small);
}

window.addEventListener('resize', checkSize);
checkSize();
Clustered Features
- 创建聚合点图层
- 创建样式唯一数组,存在时直接返回,不存在时创建
代码:
import 'ol/ol.css';
import Feature from 'ol/Feature';
import Map from 'ol/Map';
import View from 'ol/View';
import Point from 'ol/geom/Point';
import {Tile as TileLayer, Vector as VectorLayer} from 'ol/layer';
import {Cluster, OSM, Vector as VectorSource} from 'ol/source';
import {Circle as CircleStyle, Fill, Stroke, Style, Text} from 'ol/style';


var distance = document.getElementById('distance');

var count = 20000;
var features = new Array(count);
var e = 4500000;
for (var i = 0; i < count; ++i) {
  var coordinates = [2 * e * Math.random() - e, 2 * e * Math.random() - e];
  features[i] = new Feature(new Point(coordinates));
}

var source = new VectorSource({
  features: features
});

var clusterSource = new Cluster({
  distance: parseInt(distance.value, 10),
  source: source
});

var styleCache = {};
var clusters = new VectorLayer({
  source: clusterSource,
  style: function(feature) {
    var size = feature.get('features').length;
    var style = styleCache[size];
    if (!style) {
      style = new Style({
        image: new CircleStyle({
          radius: 10,
          stroke: new Stroke({
            color: '#fff'
          }),
          fill: new Fill({
            color: '#3399CC'
          })
        }),
        text: new Text({
          text: size.toString(),
          fill: new Fill({
            color: '#fff'
          })
        })
      });
      styleCache[size] = style;
    }
    return style;
  }
});

var raster = new TileLayer({
  source: new OSM()
});

var map = new Map({
  layers: [raster, clusters],
  target: 'map',
  view: new View({
    center: [0, 0],
    zoom: 2
  })
});

distance.addEventListener('input', function() {
  clusterSource.setDistance(parseInt(distance.value, 10));
});
Smoothing lines using Chaikins algorithm
- 使用插件平滑折线
- setCoordinates()方法设置几何要素的坐标点
<html lang="en">
  <head>
    <title>Smoothing lines using Chaikins algorithmtitle>

    <script src="https://cdn.polyfill.io/v2/polyfill.min.js?features=requestAnimationFrame,Element.prototype.classList,URL">script>
    <style>
      .map {
        width: 100%;
        height:400px;
      }
    style>
  head>
  <body>
    <div id="map" class="map">div>
    <form class="form-inline">
      <label for="shall-smoothen">Smooth drawn geometry?label>
      <input id="shall-smoothen" type="checkbox" checked><br>
      <label for="iterations">Number of smoothingslabel>
      <input style="width: 250px;" type="range" id="iterations" min="2" max="10" step="1" value="5">
    form>
    <script src="index.js">script>
  body>
html>
import 'ol/ol.css';
import Map from 'ol/Map';
import View from 'ol/View';
import {Tile as TileLayer, Vector as VectorLayer} from 'ol/layer';
import {OSM, Vector as VectorSource} from 'ol/source';
import Draw from 'ol/interaction/Draw';

import smooth from 'chaikin-smooth';

function makeSmooth(path, numIterations) {
  numIterations = Math.min(Math.max(numIterations, 1), 10);
  while (numIterations > 0) {
    path = smooth(path);
    numIterations--;
  }
  return path;
}

var vectorSource = new VectorSource({});

var map = new Map({
  layers: [
    new TileLayer({
      source: new OSM(),
      opacity: 0.5
    }),
    new VectorLayer({
      source: vectorSource
    })
  ],
  target: 'map',
  view: new View({
    center: [1078373.5950, 6871994.5910],
    zoom: 5
  })
});

var shallSmoothen = document.getElementById('shall-smoothen');
var numIterations = document.getElementById('iterations');

var draw = new Draw({
  source: vectorSource,
  type: 'LineString'
});
map.addInteraction(draw);
draw.on('drawend', function(event) {
  if (!shallSmoothen.checked) {
    return;
  }
  var feat = event.feature;
  var geometry = feat.getGeometry();
  var coords = geometry.getCoordinates();
  var smoothened = makeSmooth(coords, parseInt(numIterations.value, 10) || 5);
  geometry.setCoordinates(smoothened);
});
Drag-and-Drop Image Vector
- dragAndDropInteraction拖拽交互,将数据直接从文件夹中拖拽到地图上显示,formatConstructors参数用于设置支持加载的地理数据的格式。
- 鼠标移动事件、点击事件回调函数中与矢量要素相关的地图方法:getEventPixel获取当前鼠标所在位置的像素值,forEachFeatureAtPixel遍历当前位置的feature,在该方法中读取feature的属性信息
代码:
import 'ol/ol.css';
import Map from 'ol/Map';
import View from 'ol/View';
import {GPX, GeoJSON, IGC, KML, TopoJSON} from 'ol/format';
import {defaults as defaultInteractions, DragAndDrop} from 'ol/interaction';
import {VectorImage as VectorImageLayer, Tile as TileLayer} from 'ol/layer';
import {BingMaps, Vector as VectorSource} from 'ol/source';

var dragAndDropInteraction = new DragAndDrop({
  formatConstructors: [
    GPX,
    GeoJSON,
    IGC,
    KML,
    TopoJSON
  ]
});

var map = new Map({
  interactions: defaultInteractions().extend([dragAndDropInteraction]),
  layers: [
    new TileLayer({
      source: new BingMaps({
        imagerySet: 'Aerial',
        key: 'AgUFo_v6f0QeqzznIRw2TQ48DYBlM4ni9F7E-C1fgvQh7IsJ5b59Fe9OGKZBU6qc'
      })
    })
  ],
  target: 'map',
  view: new View({
    center: [0, 0],
    zoom: 2
  })
});

dragAndDropInteraction.on('addfeatures', function(event) {
  var vectorSource = new VectorSource({
    features: event.features
  });
  map.addLayer(new VectorImageLayer({
    source: vectorSource
  }));
  map.getView().fit(vectorSource.getExtent());
});

var displayFeatureInfo = function(pixel) {
  var features = [];
  map.forEachFeatureAtPixel(pixel, function(feature) {
    features.push(feature);
  });
  if (features.length > 0) {
    var info = [];
    var i, ii;
    for (i = 0, ii = features.length; i < ii; ++i) {
      info.push(features[i].get('name'));
    }
    document.getElementById('info').innerHTML = info.join(', ') || ' ';
  } else {
    document.getElementById('info').innerHTML = ' ';
  }
};

map.on('pointermove', function(evt) {
  if (evt.dragging) {
    return;
  }
  var pixel = map.getEventPixel(evt.originalEvent);
  displayFeatureInfo(pixel);
});

map.on('click', function(evt) {
  displayFeatureInfo(evt.pixel);
});


