Coursera | Andrew Ng (03-week2-2.5)—不匹配数据分布的偏差和方差
该系列仅在原课程基础上部分知识点添加个人学习笔记,或相关推导补充等。如有错误,还请批评指教。在学习了 Andrew Ng 课程的基础上,为了更方便的查阅复习,将其整理成文字。因本人一直在学习英语,所以该系列以英文为主,同时也建议读者以英文为主,中文辅助,以便后期进阶时,为学习相关领域的学术论文做铺垫。- ZJ
Coursera 课程 |deeplearning.ai |网易云课堂
转载请注明作者和出处:ZJ 微信公众号-「SelfImprovementLab」
知乎:https://zhuanlan.zhihu.com/c_147249273
CSDN:http://blog.csdn.net/junjun_zhao/article/details/79167515
2.5 Bias and Variance with mismatched data distributions (不匹配数据划分的偏差和方差)
(字幕来源:网易云课堂)
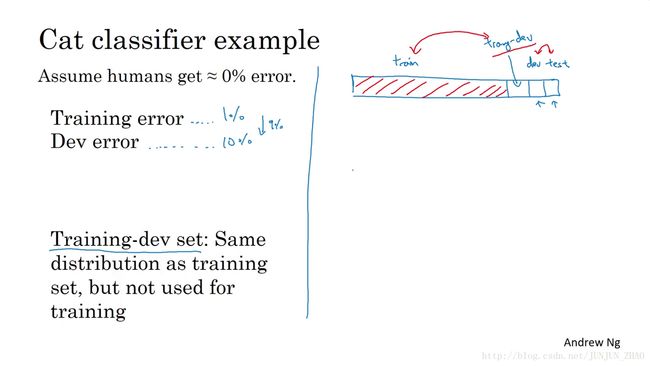
Estimating the bias and variance of your learning algorithm really helps you prioritize what to work on next.But the way you analyze bias and variance changes when your training set comes from a different distribution than your dev and test sets.Let’s see how.Let’s keep using our cat classification example and let’s say humans get near perfect performance on this.So, Bayes error, or Bayes optimal error, we know is nearly 0% on this problem.So, to carry out error analysis you usually look at the training error and also look at the error on the dev set.So let’s say, in this example that your training error is 1%,and your dev error is 10%.If your dev data came from the same distribution as your training set,you would say that here you have a large variance problem,that your algorithm’s just not generalizing well from the training set which it’s doing well, on to the dev set, which it’s suddenly doing much worse on.But in the setting where your training data and your dev data comes from a different distribution,you can no longer safely draw this conclusion.In particular, maybe it’s doing just fine on the dev set,it’s just that the training set was really easybecause it was high res,very clear images, and maybe the dev set is just much harder.So maybe there isn’t a variance problem and this just reflects that the dev set contains images that are much more difficult to classify accurately.
估计学习算法的偏差和方差 ,真的可以帮你确定接下来应该优先做的方向,但是 当你的训练集来自和开发集和测试集不同分布时,分析偏差和方差的方式可能不一样,我们来看为什么,我们继续用猫分类器为例,我们说人类在这个任务上能做到几乎完美,所以 贝叶斯错误率 或者说贝叶斯最优错误率 我们知道这个问题里几乎是 0%,所以要进行错误率分析 你通常需要看训练错误,也要看看开发集的错误,比如说 在这个例子中 你的训练集错误是1%,你的开发集错误是 10%,如果你的开发集来自和训练集一样的分布,你可能会说 这里存在很大的方差问题,你的算法不能很好的从训练集出发泛化,它处理训练集很好 但处理开发集就突然间效果很差了,但如果你的训练数据和开发数据,来自不同的分布,你就不能再放心下这个结论了,特别是 也许算法在开发集上做得不错,可能因为训练集很容易识别,因为训练集都是高分辨率图片,很清晰的图像 但开发集要难以识别得多,所以也许软件没有方差问题 这只不过反映了,开发集包含更难准确分类的图片。
So the problem with this analysis is that when you went from the training error to the dev error, two things changed at a time.One is that the algorithm saw data in the training set but not in the dev set.Two, the distribution of data in the dev set is different.And because you changed two things at the same time,it’s difficult to know of this 9% increase in error,how much of it is because the algorithm didn’t see the data in the dev set,so that’s some of the variance part of the problem.And how much of it, is because the dev set data is just different.So, in order to tease out these two effects,and if you didn’t totally follow what these two different effects are, don’t worry,we will go over it again in a second.But in order to tease out 梳理出 these two effects it will be useful to define a new piece of data which we’ll call the training-dev set.So, this is a new subset of data,which we carve out that should have the same distribution as training sets,but you don’t explicitly train in your network on this.So here’s what I mean.Previously we had set up some training sets and some dev sets and some test sets as follows.And the dev and test sets have the same distribution,but the training sets will have some different distribution.What we’re going to do is randomly shuffle the training sets and then carve out just a piece of the training set to be the training-dev set.So just as the dev and test set have the same distribution,the training set and the training-dev set, also have the same distribution.But, the difference is that now you train your neural network,just on the training set proper.You won’t let the neural network,you won’t run backpropagation on the training-dev portion of this data.To carry out error analysis,what you should do is now look at the error of your classifier on the training set,on the training-dev set, as well as on the dev set.
所以这个分析的问题在于 当你看训练错误,再看开发错误 有两件事变了,首先算法只见过训练集数据 没见过开发集数据,第二 开发集数据来自不同的分布,而且因为你同时改变了两件事情,很难确认这增加的 9% 错误率,有多少是因为算法没看到开发集中的数据导致的,这是问题方差的部分,有多少是因为开发集数据就是不一样,为了弄清楚哪个因素影响更大,如果你完全不懂这两种影响到底是什么 别担心,我们马上会再讲一遍,但为了分辨清楚两个因素的影响,定义一组新的数据是有意义的,我们称之为训练-开发集,所以这是一个新的数据子集,我们应该从训练集的分布里挖出来,但你不会用来训练你的网络,我的意思是,我们已经设立过这样的训练集,开发集和测试集了,并且开发集和测试集来自相同的分布,但训练集来自不同的分布,我们要做的是随机打散训练集,然后分出一部分训练集作为 训练-开发集,就像开发集和测试集来自同一分布,训练集和训练-开发集 也来自同一分布,但不同的地方是 现在你只在,训练集训练你的神经网络,你不会让神经网络,在训练-开发集上跑后向传播,为了进行错误分析,你应该做的是看看分类器在训练集上的错误,训练-开发集上的错误 还有开发集上的错误。
So let’s say in this example that your training error is 1%.And let’s say the error on the training-dev set is 9%,and the error on the dev set is 10%, same as before.What you can conclude from this is that when you went from training data to training dev data the error really went up a lot.And only the difference between the training data and the training-dev data is that your neural network got to sort the first part of this.It was trained explicitly on this,but it wasn’t trained explicitly on the training-dev data.So this tells you that you have a variance problem.Because the training-dev error was measured on data that comes from the same distribution as your training set.So you know that even though your neural network does well in a training set,it’s just not generalizing well to data in the training-dev set which comes from the same distribution,but it’s just not generalizing well to data from the same distribution that it hadn’t seen before.So in this example we have really a variance problem.
比如说这个例子中 训练错误是 1%,我们说训练-开发集上的错误是 9%,然后开发集错误是 10% 和以前一样,你就可以从这里得到结论,当你从训练数据变到训练-开发集数据时,错误率真的上升了很多,而训练数据和训练-开发数据的差异在于,你的神经网络能看到第一部分数据,并直接在上面做了训练,但没有在训练-开发集上直接训练,这就告诉你 算法存在方差问题,因为训练-开发集的错误率,是在和训练集来自同一分布的数据中测得的,所以你知道 尽管你的神经网络在训练集中表现良好,但无法泛化到来自相同分布的,训练-开发集里,它无法很好地泛化推广到,来自同一分布 但以前没见过的数据中,所以在这个例子中我们确实有一个方差问题。
Let’s look at a different example.Let’s say the training error is 1%, and the training-dev error is 1.5%,but when you go to the dev set your error is 10%.So now, you have actually a pretty low variance problem,because when you went from training data that you’ve seen to the training-dev data that the neural network has not seen, the error increases only a little bit,but then it really jumps when you go to the dev set.So this is a data mismatch problem, where data mismatched.So this is a data mismatch problem,because your learning algorithm was not trained explicitly on data from training-dev or dev,but these two data sets come from different distributions.But whatever algorithm it’s learning,it works great on training-dev but it doesn’t work well on dev.So somehow your algorithm has learned to do well on a different distribution than what you really care about, so we call that a data mismatch problem.
我们来看一个不同的例子,假设训练错误为 1% 训练-开发错误为 1.5%,但当你开始处理开发集时 错误率上升到 10%,现在你的方差问题就很小了,因为当你从见过的训练数据转到训练-开发集数据,神经网络还没有看到的数据 错误率只上升了一点点,但当你转到开发集时 错误率就大大上升了,所以这是数据不匹配的问题 数据不匹配,所以这是一个数据不匹配的问题,因为你的学习算法,没有直接在训练-开发集或者开发集训练过,但是这两个数据集来自不同的分布,但不管算法在学习什么,它在训练-开发集上做的很好 但开发集上做的不好,所以总之你的算法擅长处理和你关心的数据不同的分布,我们称之为数据不匹配的问题。
Let’s just look at a few more examples.I’ll write this on the next row since I’m running out of space on top.So Training error, Training-Dev error, and Dev error.Let’s say that training error is 10%,training-dev error is 11%, and dev error is 12%.Remember that human level proxy for Bayes error is roughly 0%.So if you have this type of performance, then you really have a bias,an avoidable bias problem, because you’re doing much worse than human level.So this is really a high bias setting.And one last example.If your training error is 10%, your training-dev error is 11% and your dev error is 20 %, then it looks like this actually has two issues.One, the avoidable bias is quite high,because you’re not even doing that well on the training set.Humans get nearly 0% error, but you’re getting 10% error on your training set.The variance here seems quite small,but this data mismatch is quite large.So for for this example I will say, you have a large bias or avoidable bias problemas well as a data mismatch problem.So let’s take what we’ve done on this slide andwrite out the general principles.
我们再来看几个例子,我会在下一行里写出来 因上面没空间了,所以训练错误 训练-开发错误 还有开发错误,我们说训练错误是10%,训练-开发错误是11% 开发错误为 12%,要记住 人类水平对贝叶斯错误率的估计大概是 0%,如果你得到了这种等级的表现 那就真的存在偏差问题了,存在可避免偏差问题 因为算法做的比人类水平差很多,所以这里的偏差真的很高,最后一个例子,如果你的训练集错误率是 10% 你的训练-开发错误率是 11%,开发错误率是20% 那么这其实有两个问题,第一 可避免偏差相当高,因为你在训练集上都没有做得很好,而人类能做到接近 0%错误率 但你的算法在训练集上错误率为 10%,这里方差似乎很小,但数据不匹配问题很大,所以对于这个例子 我说 如果你有很大的偏差 或者可避免偏差问题,还有数据不匹配问题,我们看看这张幻灯片里做了什么,然后写出一般的原则。
The key quantities I would look at are human level error, your training set error,your training-dev set error.So that’s the same distribution as the training set,but you didn’t train explicitly on it.Your dev set error, and depending on the differences between these errors,you can get a sense of how big is the avoidable bias, the variance,the data mismatch problems.So let’s say that human level error is 4%.Your training error is 7%.And your training-dev error is 10%.And the dev error is 12%.So this gives you a sense of the avoidable bias.because you know, you’d like your algorithm to do at least as well or approach human level performance maybe on the training set.This is a sense of the variance.So how well do you generalize from the training set to the training-dev set?This is the sense of how much of a data mismatch problem have you have.And technically you could also add one more thing,which is the test set performance, and we’ll write test error.You shouldn’t be doing development on your test set because you don’t want to overfit your test set.But if you also look at this,then this gap here tells you the degree of overfitting to the dev set.So if there’s a huge gap between your dev set performance andyour test set performance, it means you maybe overtuned to the dev set.And so maybe you need to find a bigger dev set, right?So remember that your dev set and your test set come from the same distribution.So the only way for there to be a huge gap here, for it to do much better on the devset than the test set, is if you somehow managed to overfit the dev set.And if that’s the case, what you might consider doing is going back andjust getting more dev set data.
我们要看的关键数据是,人类水平错误率 你的训练集错误率,训练-开发集错误率,所以这分布和训练集一样,但你没有直接在上面训练,你的开发集错误率 取决于这些错误率之间差距有多大,你可以大概知道 可避免偏差 方差,数据不匹配问题各自有多大,我们说人类水平错误率是 4%的话,你的训练错误率是 7%,而你的训练-开发错误是 10%,而开发错误是 12%,这样你就大概知道可避免偏差有多大,因为你知道 你希望你的算法至少要在,训练集上的表现接近人类,而这大概表明了方差大小,所以你从训练集泛化推广到训练-开发集时效果如何? 而这告诉你数据不匹配的问题大概有多大,技术上你还可以再加入一个数字,就是测试集表现 我们写成测试集错误率,你不应该在测试集上开发,因为你不希望对测试集过拟合,但如果你看看这个,那么这里的差距就说明你对开发集过拟合的程度,所以如果开发集表现,和测试集表现有很大差距 那么你可能对开发集过拟合了,所以也许你需要一个更大的开发集 对吧,要记住 你的开发集和测试集来自同一分布,所以这里存在很大差距的话 如果算法在开发集上做的很好,比测试集好得多 那么你就可能对开发集过拟合了,如果是这种情况 那么你可能要往回退一步,然后收集更多开发集数据。
Now, I’ve written these numbers,as you go down the list of numbers, always keep going up.Here’s one example of numbers that doesn’t always go up,maybe human level performance is 4%, training error is 7%,training-dev error is 10%, but let’s say that we go to the dev set.You find that you actually, surprisingly, do much better on the dev set.Maybe this is 6%, 6% as well.So you have seen effects like this, working onfor example a speech recognition task,where the training data turned out to be much harder than your dev set and test set.So these two were evaluated on your training set distribution and these two were evaluated on your dev/test set distribution.So sometimes if your dev/test set distributionis much easier for whatever application you’re working onthen these numbers can actually go down.So if you see funny things like this,there’s an even more general formulation of this analysis that might be helpful.Let me quickly explain that on the next slide.
现在我写出这些数字,这数字列表越往后 数字越大,这里还有个例子 其中数字并没有一直变大,也许人类的表现是 4% 训练错误率是 7%,训练-开发错误率是 10% 但我们看看开发集,你发现 很意外 算法在开发集上做的更好,也许是 6%,所以如果你见到这种现象,比如说在处理语音识别任务时发现这样,其中训练数据,其实比你的开发集和测试集难识别得多,所以这两个是从训练集分布评估的,而这两个是从开发测试集分布评估的,所以有时候如果你的开发测试集分布,比你应用实际处理的数据要容易得多,那么这些错误率可能真的会下降,所以如果你看到这样的有趣的事情,可能需要比这个分析更普适的分析,我在下一张幻灯片里快速解释一下。
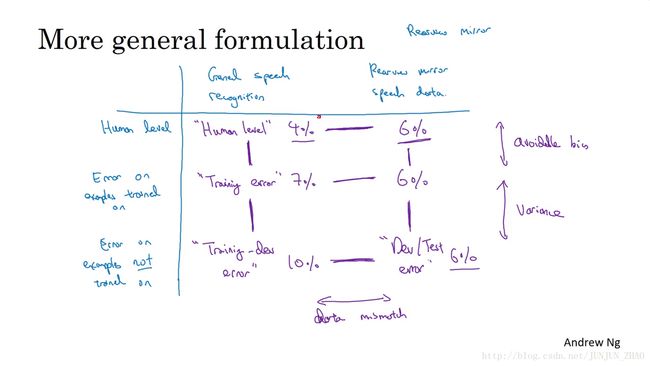
So, let me motivate this using the speech activated rear-view mirror example.It turns out that the numbers we’ve been writing down can be placed into a table where on the horizontal axis, I’m going to place different data sets.So for example, you might have data from your general speech recognition task.So you might have a bunch of data that you just collected from a lot of speech recognition problems you worked on from small speakers,data you have purchased and so on.And then you all have the rear view mirror specific speech data,recorded inside the car.So on this x axis on the table, I’m going to vary the data set.On this other axis,I’m going to label different ways or algorithms for examining the data.So first, there’s human level performance,which is how accurate are humans on each of these data sets?Then there is the error on the examples that your neural network has trained on.And then finally there’s error on the examples thatyour neural network has not trained on.
所以 我们就以语音激活后视镜为例子,事实证明 我们一直写出的数字可以放到一张表里,在水平轴上 我要放入不同的数据集,比如说 你可能从一般语音识别任务里得到很多数据,所以你可能会有一堆数据,来自小型智能音箱的语音识别问题的数据,你购买的数据等等,然后你收集了和后视镜有关的语音数据,在车里录的,所以这是表格的x轴 不同的数据集,在另一条轴上,我要标记处理数据不同的方式或算法,首先 人类水平,人类处理这些数据集时准确度是多少,然后这是神经网络训练过的数据集上,达到的错误率,然后还有神经网络没有训练过的数据集上,达到的错误率。
So turns out that what we’re calling on a human level on the previous slide,there’s the number that goes in this box,which is how well do humans do on this category of data.Say data from all sorts of speech recognition tasks,the thousand utterances that you could into your training set.And the example in the previous slide is this 4%.This number here was our, maybe the training error.Which in the example in the previous slide was 7%Right, if you’re learning algorithm has seen this example,performed gradient descent on this example,and this example came from your training set distribution,or some general speech recognition distribution.How well does your algorithm do on the example it has trained on?Then here is the training-dev set error.It’s usually a bit higher, which is for data from this distribution,from general speech recognition, if your algorithm did not train explicitly onsome examples from this distribution, how well does it do?And that’s what we call the training dev error.And then if you move over to the right,this box here is the dev set error,or maybe also the test set error.Which was 6% in the example just now.And dev and test error, it’s actually technically two numbers, buteither one could go into this box here.And this is if you have data from your rearview mirror,from actually recorded in the car from the rearview mirror application,but your neural network did not perform back propagation on this example,what is the error?So what we’re doing in the analysis in the previous slide waslook at differences between these two numbers,these two numbers, and these two numbers.And this gap here is a measure of avoidable bias.This gap here is a measure of variance,and this gap here was a measure of data mismatch.And it turns out that it could be useful toalso throw in the remaining two entries in this table.
所以结果我们上一张幻灯片说是人类水平的错误率,数字填入这个单元格里,人类对这一类数据处理得有多好,比如来自各种语音识别系统的数据,那些进入你的训练集的成千上万的语音片段,而上一张幻灯片中的例子是 4%,这个数字 可能是我们的训练错误率,在上一张幻灯片中的例子中是 7%,是的 如果你的学习算法见过这个样本,在这个样本上跑过梯度下降,这个样本来自你的训练集分布,或一般的语音识别数据分布,你的算法在训练过的数据中表现如何呢?然后这就是训练-开发集错误,通常来自这个分布的错误率会高一点,一般的语音识别数据 如果你的算法没在,来自这个分布的样本上训练过 它的表现如何呢? 这就是我们说的训练-开发集错误,如果你移到右边去,这个单元格是开发集错误,也可能是测试集错误,在刚刚的例子中是 6%,而开发集和测试集 实际上是两个数字,但都可以放入这个单元格里,如果你有来自后视镜的数据,来自从后视镜应用在车里实际录得的数据,但你的神经网络没有在这些数据上做过反向传播,那么错误率是多少呢?我们在上一张幻灯片作的分析是,观察这两个数字之间的差异,还有这两个数字之间 这两个数字之间,这个差距衡量了可避免偏差大小,这个差距衡量了方差大小,而这个差距衡量了数据不匹配问题的大小,事实证明 把剩下的两个数字,也放到这个表格里 也是有用的。
And so if this turns out to be also 6%,and the way you get this number is you ask some humans to label their rearview mirror speech dataand just measure how good humans are at this task.And maybe this turns out also to be 6%.And the way you do that is you take some rearview mirror speech data,put it in the training set so the neural network learns on it as well,and then you measure the error on that subset of the data.But if this is what you get, then, well, it turns out that you’re actually already performing at the level of humans on this rearview mirror speech data,so maybe you’re actually doing quite well on that distribution of data.When you do this more subsequent analysis,it doesn’t always give you one clear path forward,but sometimes it just gives you additional insights as well.So for example, comparing these two numbers in this case tells us that for humans, the rearview mirror speech data is actually harder than for general speech recognition, because humans get 6% error, rather than 4% error.But then looking at these differences as well may help you underst and bias and variance and data mismatch problems in different degrees.
如果结果这也是 6%,那么你获得这个数字的方式是,你让一些人类自己标记他们的后视镜语音识别数据,看看人类在这个任务里能做多好,也许结果也是6%,做法就是 你收集一些后视镜语音识别数据,把它放在训练集中 让神经网络去学习,然后测量那个数据子集上的错误率,但如果你得到这样的结果 好吧 那就是说你已经在后视镜语音数据上达到人类水平了,所以也许你对那个数据分布做的已经不错了,当你继续进行更多分析时,分析并不一定会给你指明一条前进道路,但有时候你可能洞察到一些特征,比如 比较这两个数字,告诉我们对于人类来说 后视镜的语音数据实际上比,一般语音识别更难 因为人类都有6% 的错误 而不是 4%的错误,但看看这个差值 你就可以了解到偏差和方差,还有数据不匹配这些问题的不同程度。
So this more general formulation is something I’ve used a few times.I’ve not used it, but for a lot of problems you find that examining this subset of entries,kind of looking at this difference and this difference and this difference,that that’s enough to point you in a pretty promising direction.But sometimes filling out this whole table can give you additional insights.Finally, we’ve previously talked a lot about ideas for addressing bias.Talked about techniques on addressing variance,but how do you address data mismatch?In particular training on data that comes from different distribution that your dev and test set can get you more dataand really help your learning algorithm’s performance.But rather than just bias and variance problems,you now have this new potential problem of data mismatch.What are some good ways that you could use to address data mismatch?I’ll be honest and say there actually aren’t greator at least not very systematic ways to address data mismatch.But there are some things you could try that could help.Let’s take a look at them in the next video.
所以更一般的分析方法是 我已经用过几次了,我还没用过 但对于很多问题来说,检查这个子集的条目,看看这个差值 这个差值 还有这个差值,已经足够让你往相对有希望的方向前进了,但有时候填满整个表格 你可能会洞察到更多特征,最后 我们以前讲过很多处理偏差的手段,讲过处理方差的手段,但怎么处理数据不匹配呢? 特别是开发集测试集和你的训练集数据,来自不同分布时 这样可以用更多训练数据,真正帮你提高学习算法性能,但是 如果问题不仅来自偏差和方差,你现在又有了这个潜在的新问题 数据不匹配,有什么好办法可以处理数据不匹配的呢? 实话说 并没有很通用,或者至少说是系统解决数据不匹配问题的方法,但你可以做一些尝试 可能会有帮助,我们在下一个视频里看看这些尝试。
So what we’ve seen is that by using training data that can come froma different distribution as a dev and test set, this could give you a lot more data and therefore help the performance of your learning algorithm.But instead of just having bias and variance as two potential problems,you now have this third potential problem, data mismatch.So what if you perform error analysis and conclude that data mismatchis a huge source of error, how do you go about addressing that?It turns out that unfortunately there aren’t super systematic ways to address data mismatch,but there are a few things you can try that could help.Let’s take a look at them in the next video.
所以我们讲了如何使用来自和开发集测试集不同分布的,训练数据 可能可以给你提供更多训练数据,因此有助于提高你的学习算法的性能,但是 潜在问题就不只是偏差和方差问题,这样做会引入第三个潜在问题 数据不匹配,如果你做了错误分析 并发现数据不匹配,是大量错误的来源 那么你怎么解决这个问题呢? 但结果很不幸,并没有特别系统的方法去解决数据不匹配问题,但你可以做一些尝试 可能会有帮助,我们来看下一段视频。
重点总结:
不同分布上的偏差和方差
通过估计学习算法的偏差和方差,可以帮助我们确定接下来应该优先努力的方向。但是当我们的训练集和开发、测试集来自不同的分布时,分析偏差和方差的方式就有一定的不同。
方差和分布原由分析
以猫分类为例,假设以人的分类误差0%作为贝叶斯误差。若我们模型的误差为:
- Training error:1%
- Dev error:10%
如果我们的训练集和开发、测试集来自相同的分布,那么我们可以说模型存在很大的方差问题。但如果数据来自不同的分布,那么我们就不能下这样的定论了。
那么我们如何去确定是由于分布不匹配的问题导致开发集的误差,还是由于算法中存在的方差问题所致?
设立“训练开发集“
训练开发集,其中的数据和训练数据来自同一分布,但是却不用于训练过程。
如果最终,我们的模型得到的误差分别为:
- Training error:1%
- Training-dev error:9%
- Dev error:10%
那么,由于训练开发集尽管和训练集来自同一分布,但是却有很大的误差, 模型无法泛化到同分布的数据,那么说明我们的模型存在方差问题。
但如果我们的模型得到的误差分别为:
- Training error:1%
- Training-dev error:1.5%
- Dev error:10%
那么在这样的情况下,我们可以看到,来自同分布的数据,模型的泛化能力强,而开发集的误差主要是来自于分布不匹配导致的。
分布不同的偏差方差分析
通过:Human level、Training set error、Training-dev set error、Dev error、Test error 之间误差的大小,可以分别得知我们的模型,需要依次在:可避免的偏差、方差、数据分布不匹配、开发集的或拟合程度,这些方面做改进。
通常情况下来说,通过不同的集合上的误差分析,我们得出的结果会是中间一列误差由小变大,即误差上升的情况。但是也有一定的可能会出现右边一列误差在开发测试集上又表现的好的情况。
下面通过一个后视镜语音检测的例子来说明。我们以该例子建立更加一般的表格。
其中,横向分别是:普通语音识别数据、后视镜语音识别数据;纵向分别是:Human level、训练数据误差、未训练数据误差。表格中不同的位置分别代表不同的数据集。
通常情况下,我们分析误差会是一个递增的情况,但是可能对于我们的模型,在后视镜语音识别的数据数据上,已经可以达到人类水平误差的 6%了,所以最终的开发测试集也会是 6%的误差,要比训练误差和训练开发误差都要小。所以如果遇到这种情况,就要利用上表进行分析。
参考文献:
[1]. 大树先生.吴恩达Coursera深度学习课程 DeepLearning.ai 提炼笔记(3-2)– 机器学习策略(2)
PS: 欢迎扫码关注公众号:「SelfImprovementLab」!专注「深度学习」,「机器学习」,「人工智能」。以及 「早起」,「阅读」,「运动」,「英语 」「其他」不定期建群 打卡互助活动。


