混淆矩阵的画法-热图采用imshow
前面系列文章讲过数据挖掘的各种知识,最近在研究人类时空动力学分析和幂率定律,发现在人类兴趣转移模型中,可以通过热图(斑图)来进行描述的兴趣转移,如下图所示。下一篇文章将简单普及人类动力学相关知识研究。
这篇文章结合Matplotlib的imshow()函数,讲述热图(斑图)绘制及相关参数基础知识。希望文章对你有所帮助,如果文章中存在错误或不足之处,还请海涵。
matplotlib 是python最著名的2D绘图库,它提供了一整套和matlab相似的命令API,十分适合交互式地进行制图。而且也可以方便地将它作为绘图控件,嵌入GUI应用程序中。通过简单的绘图语句,就可以绘制出高质量的图了。
这里我们就主要讲一下inshow()函数的使用吧。
一、引入matplotlib函数库
如果你使用的是windows平台,大家可以直接下载对应版本的matplotlib库的exe文件安装即可。
使用下面的命令引入matplotlib的pyplot模块:
import matplotlib.pyplot as plt
为方便起见,这样我们就可以用plt来代替matplotlib.pyplot使用了。
二、Figure和Subplot
matplotlib的图像都位于Figure对象中,实际上就是创建了一个空的图像窗口。可以用plt.figure创建一个新的Figure。
fig = plt.figure()
不能通过空Figure绘图,必须用add_subplot()创建一个或多个子sunplot绘图区才能绘图。
ax = fig.add_subplot(221)
意思是:绘制2×2两行两列共4个subplot图像,当前选中第一个。编号从1开始。
得到如下的图像:
三、绘制z = sqrt(x2+y2) 的二维函数输出图像
(1)准备数据
我们采用二维数组产生两个二维矩阵,对应于所有的(x,y)对。
要使用数组,我们使用NumPy 模块。
import numpy as np
points = np.arange(-5,5,0.01) #产生1000个-5到5等间隔的点
xs,ys = np.meshgrid(points,points) #np.meshgrid()接受两个一维数组产生两个二维矩阵((x,y)对)。
z = np.sqrt(xs2+ys2) #计算z = sqrt(x2+y2)的值
(2)绘图
ax = fig.add_subplot(221) #第一个子图
ax.imshow(z) #默认配置
ax = fig.add_subplot(222) #第一个子图
ax.imshow(z,cmap = plt.cm.gray) #第二个子图,使用自定义的colormap(灰度图)
ax = fig.add_subplot(223) #第一个子图
ax.imshow(z,cmap=plt.cm.cool) #第二个子图,使用自定义的colormap
ax = fig.add_subplot(224) #第一个子图
ax.imshow(z,cmap=plt.cm.hot) #第二个子图,使用自定义的colormap
plt.show() #显示图像
于是,漂亮的图像就出来了。
可是,细心的你发现,图的坐标怎么是0-1000呢?是这样的,我们给imshow传入z矩阵是1000×1000的,z的索引其实就是图像的坐标,而其值才是通过图的颜色表现出来的。
作者:好多鱼哦
来源:CSDN
原文:https://blog.csdn.net/shuke1991/article/details/50462580
版权声明:本文为博主原创文章,转载请附上博文链接!
二. imshow详解热图知识
热图(heatmap)是数据分析的常用方法,通过色差、亮度来展示数据的差异、易于理解。Python在Matplotlib库中,调用imshow()函数实现热图绘制。
参考资料:http://matplotlib.org/users/image_tutorial.html
源码介绍如下图所示:
作者:经年不往
来源:CSDN
原文:https://blog.csdn.net/mago2015/article/details/82896070
版权声明:本文为博主原创文章,转载请附上博文链接!在这里插入代码片
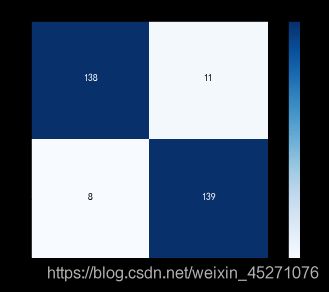
def plot_confusion_matrix(cm, classes,
                          title='Confusion matrix',
                          cmap=plt.cm.Blues):
    """
    This function prints and plots the confusion matrix.
    """
    plt.imshow(cm, interpolation='nearest', cmap=cmap)
    plt.title(title)
    plt.colorbar()
    tick_marks = np.arange(len(classes))
    plt.xticks(tick_marks, classes, rotation=0)
    plt.yticks(tick_marks, classes)

    thresh = cm.max() / 2.
    for i, j in itertools.product(range(cm.shape[0]), range(cm.shape[1])):
        plt.text(j, i, cm[i, j],
                 horizontalalignment="center",
                 color="white" if cm[i, j] > thresh else "black")

    plt.tight_layout()
    plt.ylabel('True label')
    plt.xlabel('Predicted label')
import itertools

def mixfig_down():
    lr = LogisticRegression(C=0.01, penalty='l1',solver='liblinear')
    lr.fit(X_train_undersample, y_train_undersample.values.ravel())
    y_pred_undersample = lr.predict(X_test_undersample.values)

    # Compute confusion matrix
    cnf_matrix = confusion_matrix(y_test_undersample, y_pred_undersample)
    np.set_printoptions(precision=2)

    print("Recall metric in the testing dataset: ", cnf_matrix[1, 1] / (cnf_matrix[1, 0] + cnf_matrix[1, 1]))

    # Plot non-normalized confusion matrix
    class_names = [0, 1]
    plt.figure()
    plot_confusion_matrix(cnf_matrix
                          , classes=class_names
                          , title='Confusion matrix')
    plt.show()

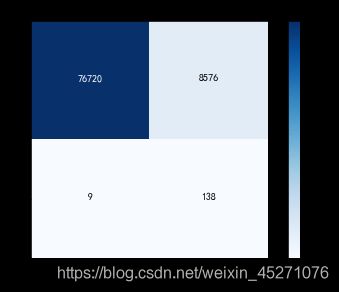
    #用下采样训练的模型验证原本的总样本
    #lr = LogisticRegression(C=best_c, penalty='l1',solver='liblinear')
    lr.fit(X_train_undersample, y_train_undersample.values.ravel())
    y_pred = lr.predict(X_test.values)
    # Compute confusion matrix
    cnf_matrix = confusion_matrix(y_test,y_pred)
    np.set_printoptions(precision=2)

    print("Recall metric in the testing dataset: ", cnf_matrix[1, 1] / (cnf_matrix[1, 0] + cnf_matrix[1, 1]))

    # Plot non-normalized confusion matrix
    class_names = [0, 1]
    plt.figure()
    plot_confusion_matrix(cnf_matrix
                          , classes=class_names
                          , title='Confusion matrix')
    plt.show()

mixfig_down()
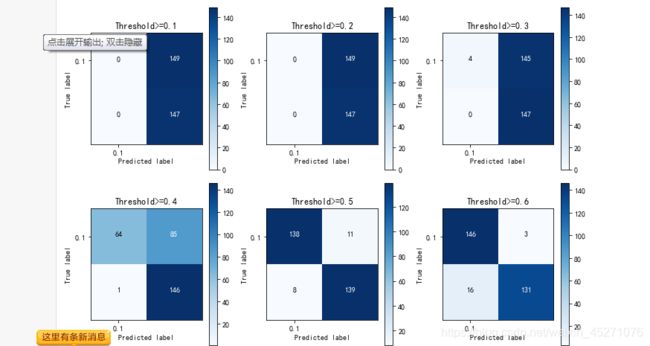
lr=LogisticRegression(C=0.01,penalty='l1')
lr.fit(X_train_undersample,y_train_undersample.values.ravel())
y_pred_undersample_proba=lr.predict_proba(X_test_undersample.values)#概率值

thresholds=[0.1,0.2,0.3,0.4,0.5,0.6,0.7,0.8,0.9]
plt.figure(figsize=(10,10))
j=1
for i in thresholds:
    y_test_predictions_high_recall=y_pred_undersample_proba[:,1]>i
    plt.subplot(3,3,j)
    j+=1
    cnf_matrix=confusion_matrix(y_test_undersample,y_test_predictions_high_recall)
    np.set_printoptions(precision=2)
    print("Recall metric in the testing dataset:",cnf_matrix[1,1]/(cnf_matrix[1,0]+cnf_matrix[1,1]))
    class_names=[0.1]
    plot_confusion_matrix(cnf_matrix,classes=class_names,title='Threshold>=%s'%i)


