降维算法-LDA线性判别分析实例
内容简介
- 线性判别分析LDA的基本概念
- 代码实例:第一部分使用python详细说明了LDA的计算过程; 第二部分记录了如何使用sklearn完成LDA。
什么是线性判别分析?
LDA,全名 Linear Discrimination Analysis, 是一种由监督学习的降维算法
LDA关心的是能够最大化类间的区分度的坐标轴成分。降特征投影到一个维度更小的k维子空间中,同时保持区分类别的信息。
原理:投影到维度更低的空间,是的投影后的点,会形成按类别区分一簇一簇的情况,相同类别的点,将会在投影后的空间中更接近。
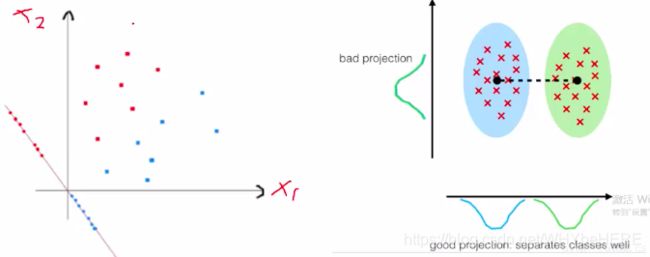
用人话说,就是怎么样最简单地将数据分类。如左边的图,红色和蓝色在原来的坐标轴内不能很好地区分;因此重新画了一条坐标轴(带点的那条斜线)这条线上可以看到,红点和蓝点分别在两边;根据新的坐标轴,将数据投影到维度更低的空间中,即右图, 两种点分成了两个簇。
课程中老师还举了这个游戏作为例子:我们的数据集就跟图中的铁坨坨一样,长得乱七八糟的,投影就是找到更适合分类的空间,是的数据集的信息可以被提取和理解;与PCA更关心方差,而LDA更关心分类。

LDA计算过程理解
(这里涉及很多公式,简单复述一下自己的理解,如果有错或者描述不清楚的地方,请评论告诉我一声)
LDA目标:投影后的两类样本中心点尽量分离,即使类间距离最大化,
使用类间距离存在的问题: 如下图情况,按X1方向可以最大化两中心点的距离,但是分的不好,可见红圈和蓝圈在x1轴有很大的重叠部分;X2轴,虽然距离小,但是分类效果更好。
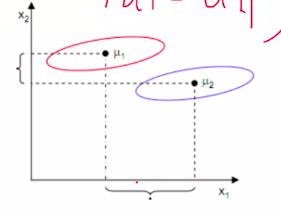
散列值:样本点的密集程度,值越大,越分散,反之越集中; 即使得类内距离(类别里面个点的距离)尽量小。
python代码实例
依旧使用鸢尾花数据集来练习, 鸢尾花数据集导入方法有很多种;直接下载文档后用read_csv();原来老师的代码是引用链接方法;个人觉得直接dataset 更方便,这里开头替换了一下取数的代码。在之前鸢尾花数据分析项目博客中有比较详细的解释这个方法,可以戳[链接]看看(https://blog.csdn.net/WHYbeHERE/article/details/106843722)
1.导入数据
#导入模块
import numpy as np
import pandas as pd
from sklearn import datasets

iris = datasets.load_iris() #直接从datasets 导出数据
X, y = iris.data, iris.target #切分数据集

df = pd.DataFrame(np.hstack((X, y.reshape(-1, 1))),index = range(X.shape[0]),columns=['sepal_length_cm','sepal_width_cm','petal_length_cm','petal_width_cm','class'] )

df.tail()
2.特征转换
from sklearn.preprocessing import LabelEncoder

#这里原本是的X和y的赋值;被注释掉了,因为我们在上一步就分好了X和y
#X = df[['sepal_length_cm','sepal_width_cm','petal_length_cm','petal_width_cm']].values
#y = df['class'].values

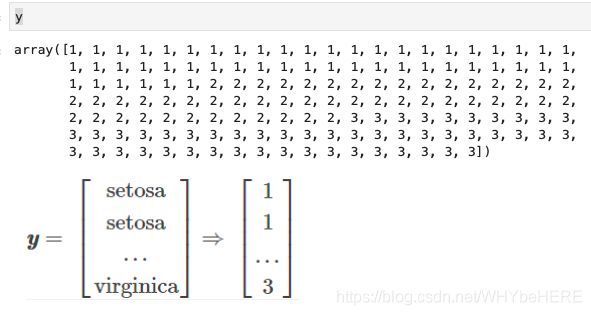
#y原本的值是三种花的名称:'Setosa','Versicolor','Virginica';需要将它们转换为电脑可以计算的数值。
enc = LabelEncoder()
label_encoder = enc.fit(y)
y = label_encoder.transform(y) + 1

#label_dict = {1: 'Setosa', 2: 'Versicolor', 3:'Virginica'}
3. 求均值向量mi
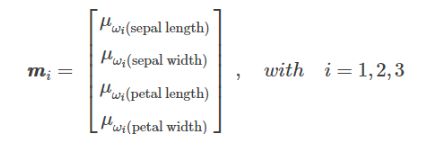
接下来需要分别求三种鸢尾花数据在不同特征维度上的均值向量mi
import numpy as np
np.set_printoptions(precision=4)

mean_vectors = []
for cl in range(1,4):
    mean_vectors.append(np.mean(X[y==cl], axis=0))
    print('Mean Vector class %s: %s\n' %(cl, mean_vectors[cl-1]))
4.计算类内散步矩阵和类间散步矩阵
#用代码实现上面的公式
S_W = np.zeros((4,4))
for cl,mv in zip(range(1,4), mean_vectors):
    class_sc_mat = np.zeros((4,4))                  # scatter matrix for every class
    for row in X[y == cl]:
        row, mv = row.reshape(4,1), mv.reshape(4,1) # make column vectors
        class_sc_mat += (row-mv).dot((row-mv).T)
    S_W += class_sc_mat                             # sum class scatter matrices
print('within-class Scatter Matrix:\n', S_W)
overall_mean = np.mean(X, axis=0)

S_B = np.zeros((4,4))
for i,mean_vec in enumerate(mean_vectors):
    n = X[y==i+1,:].shape[0]
    mean_vec = mean_vec.reshape(4,1) # make column vector
    overall_mean = overall_mean.reshape(4,1) # make column vector
    S_B += n * (mean_vec - overall_mean).dot((mean_vec - overall_mean).T)

print('between-class Scatter Matrix:\n', S_B)
5.求解矩阵的特征值:两个矩阵相乘
eig_vals, eig_vecs = np.linalg.eig(np.linalg.inv(S_W).dot(S_B))

for i in range(len(eig_vals)):
    eigvec_sc = eig_vecs[:,i].reshape(4,1)
    print('\nEigenvector {}: \n{}'.format(i+1, eigvec_sc.real))
    print('Eigenvalue {:}: {:.2e}'.format(i+1, eig_vals[i].real))
6.特征值与特征向量:
- 特征向量:表示映射方向
- 特征值:特征向量的重要程度
#Make a list of (eigenvalue, eigenvector) tuples
eig_pairs = [(np.abs(eig_vals[i]), eig_vecs[:,i]) for i in range(len(eig_vals))]

# Sort the (eigenvalue, eigenvector) tuples from high to low
eig_pairs = sorted(eig_pairs, key=lambda k: k[0], reverse=True)

# Visually confirm that the list is correctly sorted by decreasing eigenvalues

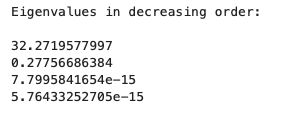
print('Eigenvalues in decreasing order:\n')
for i in eig_pairs:
    print(i[0])
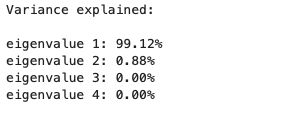
print('Variance explained:\n')
eigv_sum = sum(eig_vals)
for i,j in enumerate(eig_pairs):
    print('eigenvalue {0:}: {1:.2%}'.format(i+1, (j[0]/eigv_sum).real))
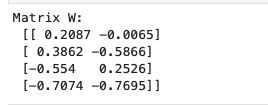
W = np.hstack((eig_pairs[0][1].reshape(4,1), eig_pairs[1][1].reshape(4,1)))
print('Matrix W:\n', W.real)
X_lda = X.dot(W)
assert X_lda.shape == (150,2), "The matrix is not 150x2 dimensional."
#画图
from matplotlib import pyplot as plt

def plot_step_lda():

    ax = plt.subplot(111)
    for label,marker,color in zip(
        range(1,4),('^', 's', 'o'),('blue', 'red', 'green')):

        plt.scatter(x=X_lda[:,0].real[y == label],
                y=X_lda[:,1].real[y == label],
                marker=marker,
                color=color,
                alpha=0.5,
                label=label
                )

    plt.xlabel('LD1')
    plt.ylabel('LD2')

    leg = plt.legend(loc='upper right', fancybox=True)
    leg.get_frame().set_alpha(0.5)
    plt.title('LDA: Iris projection onto the first 2 linear discriminants')

    # hide axis ticks
    plt.tick_params(axis="both", which="both", bottom="off", top="off",
            labelbottom="on", left="off", right="off", labelleft="on")

    # remove axis spines
    ax.spines["top"].set_visible(False)
    ax.spines["right"].set_visible(False)
    ax.spines["bottom"].set_visible(False)
    ax.spines["left"].set_visible(False)

    plt.grid()
    plt.tight_layout
    plt.show()

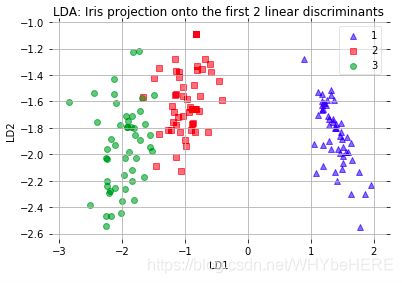
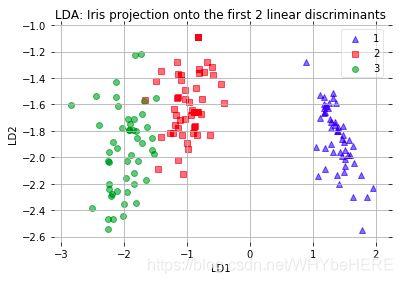
plot_step_lda()
*直接使用sklearn中的LDA
from sklearn.discriminant_analysis import LinearDiscriminantAnalysis as LDA

# LDA
sklearn_lda = LDA(n_components=2)
X_lda_sklearn = sklearn_lda.fit_transform(X, y)

from matplotlib import pyplot as plt
def plot_scikit_lda(X, title):

    ax = plt.subplot(111)
    for label,marker,color in zip(
        range(1,4),('^', 's', 'o'),('blue', 'red', 'green')):

        plt.scatter(x=X[:,0][y == label],
                    y=X[:,1][y == label] * -1, # flip the figure
                    marker=marker,
                    color=color,
                    alpha=0.5,
                    label=label
                   )

    plt.xlabel('LD1')
    plt.ylabel('LD2')

    leg = plt.legend(loc='upper right', fancybox=True)
    leg.get_frame().set_alpha(0.5)
    plt.title(title)

    # hide axis ticks
    plt.tick_params(axis="both", which="both", bottom="off", top="off",
            labelbottom="on", left="off", right="off", labelleft="on")

    # remove axis spines
    ax.spines["top"].set_visible(False)
    ax.spines["right"].set_visible(False)
    ax.spines["bottom"].set_visible(False)
    ax.spines["left"].set_visible(False)

    plt.grid()
    plt.tight_layout
    plt.show()


plot_step_lda()
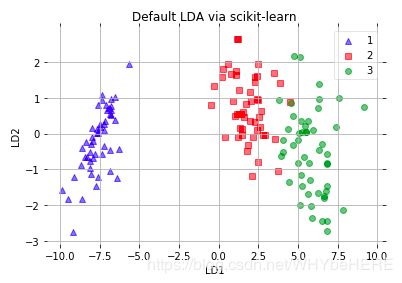
plot_scikit_lda(X_lda_sklearn, title='Default LDA via scikit-learn')

