吴恩达机器学习编程作业2逻辑回归(python)
网上的python实现基本都看了,重复率很高,第一个写出来的真大佬啊
我使用jupyter notebook方便可视化和理解,只需要在一个文件里写完就可以了,不用绕来绕去。
1.逻辑回归(不包含正则化)
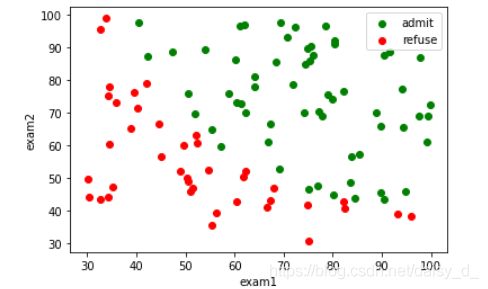
题意:ex2data1.txt包含三列数据,第一列第一次考试成绩,第二列第二次考试成绩。两次成绩决定通过不通过。第三列1表示admit,0表示refuse。
1.1可视化原始数据
import matplotlib.pyplot as plt
import numpy as np
import scipy.optimize as opt
from sklearn.metrics import classification_report
import pandas as pd
from sklearn import linear_model
from sklearn.metrics import classification_report
def raw_data(path):
    data = pd.read_csv(path,names=['exam1','exam2','admit'])
    return data
data = raw_data('ex2data1.txt')#注意自己的路径
data.describe()
#绘制数据
def draw_data(data):
    accept = data[data['admit']==1]
    refuse = data[data['admit']==0]
    plt.scatter(accept['exam1'],accept['exam2'],c='g',label='admit')
    plt.scatter(refuse['exam1'],refuse['exam2'],c='r',label='refuse')
    plt.xlabel('exam1')
    plt.ylabel('exam2')
    plt.legend()
    return plt
plt=draw_data(data)
plt.show()
1.2实施
#sigmoid函数
def sigmoid(z):
    return 1/(1+np.exp(-z))
sigmoid(30)#测试一下sigmoid函数,越大越接近于1
sigmoid(0)
#代价函数
def cost_function(theta,x,y):
    m = x.shape[0] #样本数量
    first = y.dot(np.log(sigmoid(x.dot(theta))))#第一部分if y=1
    second = (1-y).dot(np.log(1-sigmoid(x.dot(theta))))#第一部分if y=0
    #
    return (-first-second)/m
#一次梯度下降
def gradient_descent(theta,x,y):
    m=x.shape[0]
    b=sigmoid(x.dot(theta))
    return (b-y).dot(x)/m
预测
def predict(theta,x):
    h = sigmoid(x.dot(theta))
    return [1 if x>=0.5 else 0 for x in h]
划分界线
#决策边界
def boundary(theta,data):
    x1 = np.arange(20,100,0.01)
    x2 = -(theta[0]+theta[1]*x1)/theta[2]
    plt=draw_data(data)
    plt.title('boundary')
    plt.plot(x1,x2)
    plt.show()
设置数据,初始参数等
x1=data['exam1']
x2=data['exam2']
x = np.c_[np.ones(x1.shape[0]),x1,x2]#拼接成完整的x
y=data['admit']
#theta初始化0
theta=np.zeros(x.shape[1])
times=200000
learning_rate=0.12
- 循环20万次的结果
for i in range(times):
    a = gradient_descent(theta,x,y)
    theta = theta-learning_rate*a
print(theta)
boundary(theta,data)
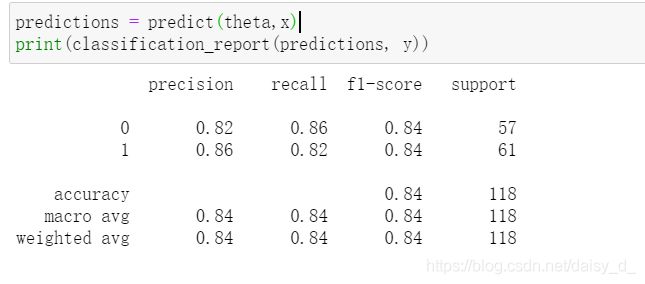
predictions = predict(theta,x)
print(classification_report(predictions, y))
for i in range(times):
    a = gradient_descent(theta,x,y)
    theta = theta-learning_rate*a
print(theta)
boundary(theta,data)
predictions = predict(theta,x)
print(classification_report(predictions, y))
2 正则化的逻辑回归
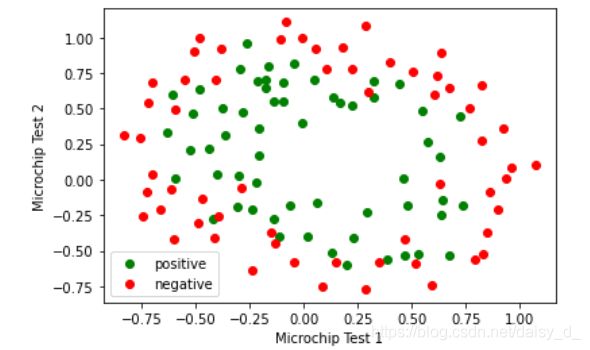
2.1 可视化
#获取原始数据
def raw_data(path):
    data = pd.read_csv(path,names=['test1','test2','admit'])
    return data
data2 = raw_data('ex2data2.txt')
data2.describe()
#绘制数据
def draw_data(data):
    positive = data2[data2['admit']==1]
    negative = data2[data2['admit']==0]
    plt.scatter(positive['test1'],positive['test2'],c='g',label='positive')
    plt.scatter(negative['test1'],negative['test2'],c='r',label='negative')
    plt.xlabel('Microchip Test 1')
    plt.ylabel('Microchip Test 2')
    plt.legend()
    return plt
plt=draw_data(data)

plt.show()
2.2 特征提取
特征提取按照作业要求
def feature_mapping(x1,x2,power):
    datamap={}
    for i in range(power+1):
        for j in range(i+1): #stop: 计数到 stop 结束,不包括stop
            datamap["f{}{}".format(j,i-j)]=np.power(x1,j)*np.power(x2,i-j)
    return pd.DataFrame(datamap)
2.3 代价函数和梯度
#代价函数
def cost_function2(theta,x,y,lmd):
    m = x.shape[0] #样本数量
    first = y.dot(np.log(sigmoid(x.dot(theta))))#第一部分if y=1
    second = (1-y).dot(np.log(1-sigmoid(x.dot(theta))))#第一部分if y=0
    third=(lmd/(2*m))*(theta[1:].dot(theta[1:]))#theta0 不惩罚,对结果影响不大
    return (-first-second)/m+third
#一次梯度下降
def gradient_descent2(theta,x,y,lmd):
    m=x.shape[0]
    b=sigmoid(x.dot(theta))
    grad = (b-y).dot(x)/m
    grad[1:]+=(lmd/m)*theta[1:]
    return grad
def predict(theta,x):
    h = sigmoid(x.dot(theta))
    return [1 if x>=0.5 else 0 for x in h]
2.4 画决策边界
def boundary2(theta,data,title):
    """
    [X,Y] = meshgrid(x,y)
    将向量x和y定义的区域转换成矩阵X和Y,
    其中矩阵X的行向量是向量x的简单复制,而矩阵Y的列向量是向量y的简单复制
    假设x是长度为m的向量,y是长度为n的向量,则最终生成的矩阵X和Y的维度都是 nm(注意不是mn)
    """
    # 绘制方程theta*x=0
    x = np.linspace(-1, 1.5, 200)
    x1, x2 = np.meshgrid(x, x)
    z = feature_mapping(x1.ravel(), x2.ravel(), 6).values
    z = z.dot(theta)
    # print(xx.shape)  # (200,200)
    # print(z.shape)  # (40000,)
    z=z.reshape(x1.shape)
    plt=draw_data(data)
    plt.contour(x1,x2,z,0)
    plt.title(title)
    plt.show()
2.5 随意练习
x1=data2['test1']
x2=data2['test2']
x = feature_mapping(x1,x2,6)
x = x.values
y=data2['admit']
#theta初始化0
theta=np.zeros(x.shape[1])
lmd = 1
times=200000
learning_rate=0.12
试试lamda等于1
for i in range(times):
    a = gradient_descent2(theta,x,y,lmd)
    theta = theta-learning_rate*a
print(theta)
boundary2(theta,data2,'lmd=1')

predictions = predict(theta,x)
print(classification_report(predictions, y))
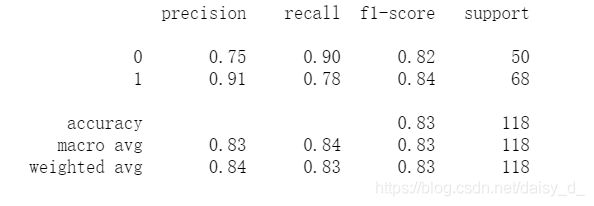
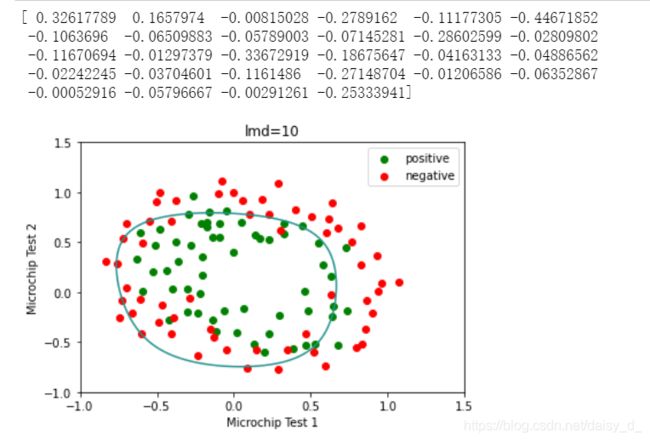
试试lamda等于10
效果变差了一些
theta=np.zeros(x.shape[1])
lmd = 10
for i in range(times):
    a = gradient_descent2(theta,x,y,lmd)
    theta = theta-learning_rate*a
print(theta)
boundary2(theta,data2,'lmd=10')
predictions = predict(theta,x)
print(classification_report(predictions, y))
theta=np.zeros(x.shape[1])
lmd = 100
for i in range(times):
    a = gradient_descent2(theta,x,y,lmd)
    theta = theta-learning_rate*a
print(theta)
boundary2(theta,data2,'lmd=100')
predictions = predict(theta,x)
print(classification_report(predictions, y))

试试lamda等于0
没有加入惩罚,可能有些过拟合,效果也不特别好
theta=np.zeros(x.shape[1])
lmd = 0
for i in range(times):
    a = gradient_descent2(theta,x,y,lmd)
    theta = theta-learning_rate*a
print(theta)
boundary2(theta,data2,'lmd=0')

