孤立森林(Iforest) 异常检测方法
孤立森林(Iforest) 异常检测方法
概述
Iforest算法常用于异常检测。孤立森林算法由08年首次提出,基于孤立森林的异常检测算法11年在tkdd问世,这两篇论文的一作是小哥Fei Tony Liu和Kai Ming Ting教授,周志华是第二作者(多篇论文有合作,猜测长期合作关系)。这时Fei Tony Liu还是蒙纳士大学(Monash University )一个博士生,目前在蒙纳士大学兼职任职,主要任职于在澳大利亚印度尼西亚经济治理合作组织(数据分析顾问)。哈哈哈哈,这些是题外话
言归正传,Iforest算法自问世以来,颇受好评,从众多异常检测算法中脱颖而出的原因在于其“又快又好”的特性,接下来简单介绍其算法原理。
算法原理
孤立森林,由多棵孤立树组成,一棵孤立树的目标是将一个样本与其余样本分离。孤立树本质是一棵二叉树,给定 n n n个 d d d维样本的数据 X X X,迭代地随机选择一个特征 q q q和该特征范围内的一个分割值 p p p,通过判断 q < p q<p q<p将 X X X二分为左孩子节点和右孩子节点。直到满足一下条件之一终止迭代:
- ∣ X ∣ |X| ∣X∣=1
- 树的高度达到限制高度
- 所有的 ∣ X ∣ |X| ∣X∣具有相同的值
这样一棵二叉树,假设所有样本都是可孤立的[无样本具有相同的值],需要 n n n个叶子节点, n − 1 n-1 n−1个内部节点,共 2 n − 1 2n-1 2n−1个节点,即内存需要和样本数量呈线性增长。
异常样本的分布显著不同于正常的大多数样本分布差异,孤立树用来检测异常的依据(假设)是:
- 异常的样本需要更少的分割次数(在孤立树中的路径更短)
- 特征具有可区别(如极值)的样本在分割过程中更早被划分
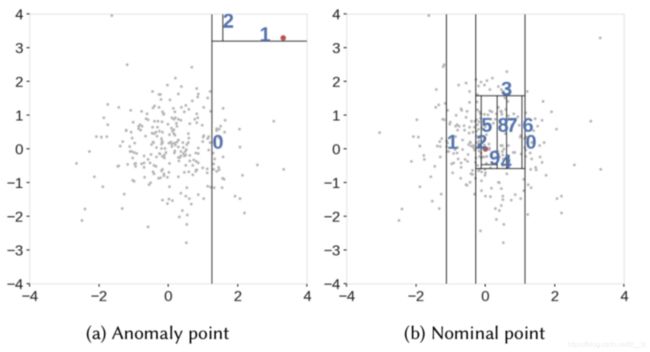
如图所示,非异常点被切分的更频繁因此,在孤立树中路径长度(可看作是被切分的次数)越小的样本,越有可能是异常点。路径长度可理解为指从根节点出发到达代表某样本的叶子节点所在层的深度。
通过不断从全量样本中随机抽取的子样本中构造孤立树,形成孤立森林。通过样本在孤立森林中的路径长度的大小,判断该样本是否是异常点。通过归一化路径长度的值来定义样本x的异常分数:
s ( x , n ) = 2 ( − E ( h ( x ) ) c ( n ) ) s(x,n) = 2^{(-\frac{E( { h(x) })}{ c(n) } )} s(x,n)=2(−c(n)E(h(x)))
其中n表示总样本数量, E ( h ( x ) ) E(h(x)) E(h(x))是孤立森林的路径长度 h ( x ) h(x) h(x)均值, c ( n ) c(n) c(n)可看作给定样本个数 n n n的二叉树的平均搜索长度, c ( n ) = 2 H ( n − 1 ) − ( 2 ( n − 1 ) / n ) c(n) = 2H(n − 1) − (2(n − 1)/n) c(n)=2H(n−1)−(2(n−1)/n)
其中 H ( i ) H(i) H(i)是谐波数, 值为 l n ( i ) + 0.5772156649 ( 欧 拉 常 数 ) ln(i) + 0.5772156649(欧拉常数) ln(i)+0.5772156649(欧拉常数)。 E ( h ( x ) ) E(h(x)) E(h(x))越趋于0,则异常分数 s s s越趋于1。
pyod的iforest接口说明
pyod是将sklearn中大部分的异常检测方法进行封装,使得调用异常检测方法和传统的分类器等的调用习惯一致,当然你也可以直接用sklearn中的包(sklearn.ensemble.IsolationForest)
参数
- n_estimators (default=100) 及分类器(孤立树)个数
- max_samples (default=“auto”) 从X中随机抽取来训练及分类器的子样本大小,参数值是int类型表示个数,float表示X的样本数量比例,auto为min(256, n_samples)
- contamination (default=0.1) 异常数据的比例,取值范围(0, 0.5)
- max_features (default=1.0) 从X中随机抽取来训练及分类器的特征数量,参数值是int类型表示个数,float表示X的样本特征数量比例
- bootstrap 采样策略 (default=False),True 无放回采样,False 有放回采样
- n_jobs (default=1) 如果为-1,表示核数
- behaviour ‘old’ or ‘new’, (default=‘old’) 和后续版本兼容问题?
- random_state 随机种子 (default=None) None则默认用np.random
- verbose 控制构建树的详细程度 (default=0)
属性/方法
- estimators_ 基分类器
- estimators_samples_ 每个及分类器的样本
- max_samples_ 实际样本数量
- decision_scores_ 训练数据的异常分数
- threshold_ 异常比例
- labels_ 0、1
- decision_function(X) 使用训练好的检测器预测X
- fit(X, y=None) 训练X
- fit_predict(X, y=None) 训练且预测X
- fit_predict_score(X, y, scoring=‘roc_auc_score’) 训练且预测X,并返回性能指标
- ‘roc_auc_score’: ROC score
- ‘prc_n_score’: Precision @ rank n score
- get_params(deep=True) 获得参数
- predict(X) 预测X
- predict_proba(X, method=‘linear’)
- set_params(**params) 设置参数
使用示例
# -*- coding: utf-8 -*-
"""Example of using Isolation Forest for outlier detection
"""
# Author: Yue Zhao 缺点
- 孤立森林只适合检测全局异常点,而不适合检测局部异常点
- 当数据特征维度较多时,不适合用此算法,过多的维度,会给算法带来很多噪声
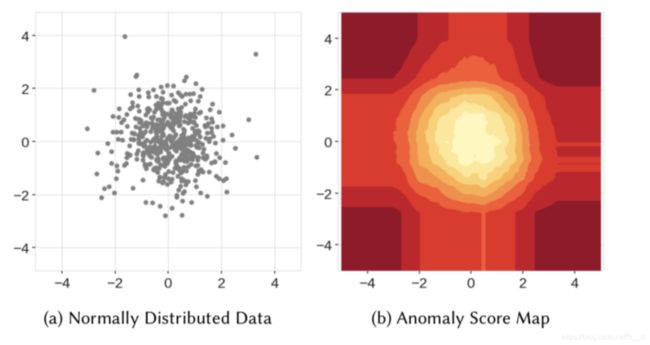
- 直观地,我们会认为异常的分数由中心向外逐渐增加,然而孤立森林算法做不到,如下右图的异常分数分布图所示,存在异常分数较低的类矩形区域,即分布在角落上的点相对更容易被“孤立”,与数据的分布(正太分布)不符
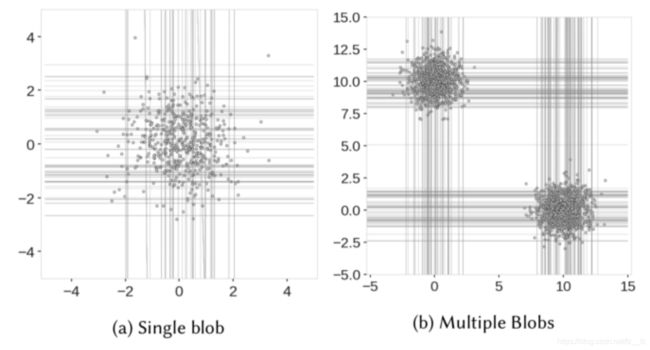
当数据不是以一个中心分布时,可能会出现伪中心

4. 我们看看孤立森林如何切分数据,左图中[4, 0]位置可能是异常点,但由于位于y轴维度的中间位置,仍然需要切分很多次,才可以将这些点“孤立”,因此其异常分数被降低,右图中左下角和右下角的样本也很难被"孤立",随机切分成两部分,仍然每部分都有很多样本,而导致伪中心点。
引用
官方API
https://scikit-learn.org/stable/modules/generated/sklearn.ensemble.IsolationForest.html
https://pyod.readthedocs.io/en/latest/
github
https://github.com/yzhao062/pyod/blob/development/docs/index.rst
https://pyod.readthedocs.io/en/latest/pyod.models.html#module-pyod.models.iforest
论文
http://202.119.32.195/cache/7/03/cs.nju.edu.cn/c452b98b5141e44d788e2a0153a8772e/icdm08b.pdf
https://cs.nju.edu.cn/zhouzh/zhouzh.files/publication/tkdd11.pdf
使用示例
https://github.com/yzhao062/pyod/blob/master/examples/iforest_example.py
其他参考
https://towardsdatascience.com/outlier-detection-with-extended-isolation-forest-1e248a3fe97b
https://towardsdatascience.com/outlier-detection-with-isolation-forest-3d190448d45e