监控实践: 基于K8S部署Prometheus+Grafana

使用Prometheus对系统进行监控,使用Grafana进行数据展示。我的环境是K8S,我的部署方式是通过 yaml文件进行部署。已经部署文件上传到了Github 地址:https://github.com/zeyangli/devops-on-k8s.
1
部署node-exporter对集群进行监控
部署node-expoter对k8s集群监控
使用DaemonSet方式
使用最新镜像:node-exporter:v0.18.1
部署描述文件如下:
在这里我创建了一个DaemonSet类型的部署,会在每个node节点上运行。运行的Namespace是在kube-system中。创建service 使用nodePort方式映射端口。
---
apiVersion: apps/v1
kind: DaemonSet
metadata:
  name: node-exporter
  namespace: kube-system
  labels:
    k8s-app: node-exporter
spec:
  selector:
    matchLabels:
      name: node-exporter
  template:
    metadata:
      labels:
        name: node-exporter
    spec:
      containers:
      - name: node-exporter
        image: prom/node-exporter:v0.18.1
        ports:
        - containerPort: 9100
          protocol: TCP
          name: http
---
apiVersion: v1
kind: Service
metadata:
  labels:
    k8s-app: node-exporter
  name: node-exporter
  namespace: kube-system
spec:
  ports:
  - name: http
    port: 9100
    nodePort: 31672
    protocol: TCP
  type: NodePort
  selector:
    k8s-app: node-exporter
2
部署Prometheus服务
部署prometheus服务
deploy.yaml
这里我创建了一个应用部署文件deployment对象,挂载configmap配置文件和volume存储持久化数据。
---apiVersion: apps/v1kind: Deploymentmetadata: labels: name: prometheus-deployment name: prometheus namespace: kube-systemspec: replicas: 1 selector: matchLabels: app: prometheus template: metadata: labels: app: prometheus spec: containers: - image: prom/prometheus:v2.15.2 name: prometheus command: - "/bin/prometheus" args: - "--config.file=/etc/prometheus/prometheus.yml" - "--storage.tsdb.path=/prometheus" - "--storage.tsdb.retention=24h" ports: - containerPort: 9090 protocol: TCP volumeMounts: - mountPath: "/prometheus" name: data - mountPath: "/etc/prometheus" name: config-volume resources: requests: cpu: 100m memory: 100Mi limits: cpu: 500m memory: 2500Mi serviceAccountName: prometheus volumes: - name: data hostPath: path: /data/devops/prometheus type: Directory - name: config-volume configMap: name: prometheus-config
service.yaml
这里我创建了一个service对象,nodePort方式暴露30003端口进行访问。
---
kind: Service
apiVersion: v1
metadata:
  labels:
    app: prometheus
  name: prometheus
  namespace: kube-system
spec:
  type: NodePort
  ports:
  - port: 9090
    targetPort: 9090
    nodePort: 30003
  selector:
    app: prometheus
RBAC Setting(配置应用程序权限)
apiVersion: rbac.authorization.k8s.io/v1
kind: ClusterRole
metadata:
  name: prometheus
rules:
- apiGroups: [""]
  resources:
  - nodes
  - nodes/proxy
  - services
  - endpoints
  - pods
  verbs: ["get", "list", "watch"]
- apiGroups:
  - extensions
  resources:
  - ingresses
  verbs: ["get", "list", "watch"]
- nonResourceURLs: ["/metrics"]
  verbs: ["get"]
---
apiVersion: v1
kind: ServiceAccount
metadata:
  name: prometheus
  namespace: kube-system
---
apiVersion: rbac.authorization.k8s.io/v1
kind: ClusterRoleBinding
metadata:
  name: prometheus
roleRef:
  apiGroup: rbac.authorization.k8s.io
  kind: ClusterRole
  name: prometheus
subjects:
- kind: ServiceAccount
  name: prometheus
  namespace: kube-system
3
部署Grafana服务
deployment
apiVersion: apps/v1
kind: Deployment
metadata:
  name: grafana-core
  namespace: kube-system
  labels:
    app: grafana
    component: core
spec:
  selector:
    matchLabels:
      app: grafana
  replicas: 1
  template:
    metadata:
      labels:
        app: grafana
        component: core
    spec:
      containers:
      - image: grafana/grafana:6.5.3
        name: grafana-core
        imagePullPolicy: IfNotPresent
        env:
          # The following env variables set up basic auth twith the default admin user and admin password.
          - name: GF_AUTH_BASIC_ENABLED
            value: "true"
          - name: GF_AUTH_ANONYMOUS_ENABLED
            value: "false"
          # - name: GF_AUTH_ANONYMOUS_ORG_ROLE
          #   value: Admin
          # does not really work, because of template variables in exported dashboards:
          # - name: GF_DASHBOARDS_JSON_ENABLED
          #   value: "true"
        readinessProbe:
          httpGet:
            path: /login
            port: 3000
          # initialDelaySeconds: 30
          # timeoutSeconds: 1
        volumeMounts:
        - name: grafana-persistent-storage
          mountPath: /var
      volumes:
      - name: grafana-persistent-storage
        hostPath:
          path: /data/devops/grafana
          type: Directory
service
apiVersion: v1
kind: Service
metadata:
  name: grafana
  namespace: kube-system
  labels:
    app: grafana
    component: core
spec:
  type: NodePort
  ports:
    - port: 3000
      nodePort: 30011
  selector:
    app: grafana
    component: core
4
访问验证
我们先看下dashboard中pod运行状态

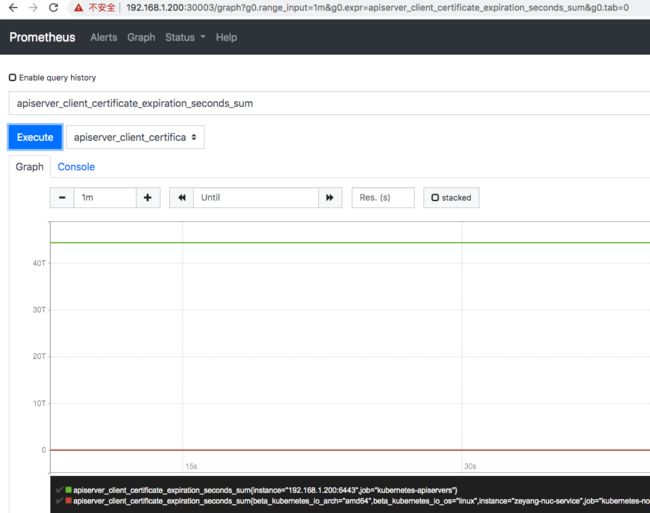
然后看下pometheus中是否有数据
访问Grafana
到此我们就成功的将Prometheus+Grafana部署到了Kubernetes系统中。接下来我们来配置grafana展示集群中的监控数据。
5
配置Grafana 面板
添加数据源

导入面板
https://grafana.com/grafana/dashboards/315

最终效果


文末分享
[课程上新]基于Jenkins的DevOps 流水线实践

