时间序列预测系列3
时间序列预测系列3
主要内容
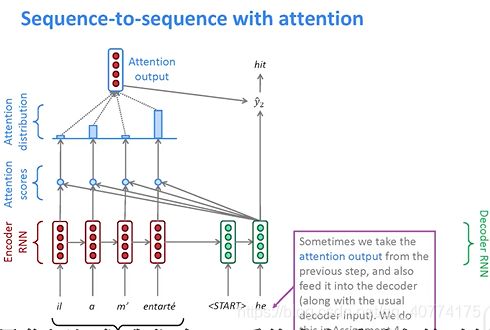
前2篇已经介绍了基本的LSTM预测模型。本文将引入注意力机制。注意力机制原理本文不进行叙述,本文专注于如何用代码实现。
往往我们预测某一值都是根据前T天的历史数据,将其输入到LSTM网络中进行预测。但其实我们可以发现对第T+1天的数据而言,前T天的数据对第T+1天的影响应该是不同的。就拿股票数据来说,可能T-1天股票价格发生了大幅度的降低,那么我们预测第T+1天时应该重点考虑到T-1天发生的变化。
因此本文的工作就是采用注意力机制,对前T天的数据分配不同的注意力权重,从而达到重点关注某些天值的效果。
正常来说,实现attention往往要引入编码解码模型(sequence to sequence model),但本次实验重点关注于如何实现attention,因此没有使用sequence to sequence model。编码解码模型与attention的结合将在下一篇文章中介绍。
实验数据
本次实验使用的是上证指数的历史数据。数据可以根据网盘地址来下载。
链接:https://pan.baidu.com/s/170F8DFQW-7a1QvKP2uC6-A
提取码:a5du
数据处理
读取数据
import os
f = open('./shangZhen.csv')
data = f.read()
f.close
lines = data.split('\n')
print(len(lines))
header = lines[0].split(',')
lines = lines[1:]
print(len(lines))
print(header)
print(lines[0])

# 将数据转为浮点数
import numpy as np
float_data = np.zeros((len(lines),9))
print(len(lines))
lines=lines[:-1]  # 最后一行为空,不要
print(len(lines))
j=0
for line in lines:
    f=1
    for i in line.split(','):
        if i == 'None':
            print(line)
            f=0
            break
    if f==1:
        tmp = [float(x) for x in line.split(',')[3:]]
        #print(tmp)
        float_data[j]=tmp
        j=j+1

data=np.zeros((j,9))
for i,line in enumerate(float_data):
    if i==j:
        break
    data[i]=line

print(data.shape)
数据标准化
mean = float_data.mean(axis=0)
float_data -= mean
std = float_data.std(axis=0)
float_data /= std

print(float_data[:,0])
获取训练数据和测试数据
# 获取训练数据
# 训练模型为:以前10天的数据预测后一天的收盘价 ,滑动窗口值设置为step
def g_data(data,lookback,step,delay,k):
    max_index = int(len(data)*0.9 ) # 前90%做为训练数据,后10%作为测试
    rows = [i for i in range(lookback,max_index-16,step)] #这里-16只是为了不越界,没有具体原因,可以自己尝试其他值,但是要确保训练数据不要包括测试数据。   samples=np.zeros((len(rows),lookback,data.shape[-1]))
    targets=np.zeros((len(rows),))
    for j,row in enumerate(rows):
        indices = range(row-lookback,row,1)
        samples[j]=data[indices]
        targets[j]=data[row+delay][k]
    return samples,targets


# 获取测试数据
def g_test(data,lookback,step,delay,k):
    min_index=int(len(data)*0.9 )
    rows = [i for i in range(min_index,len(data)-lookback-1,step)]
    samples=np.zeros((len(rows),lookback,data.shape[-1]))
    targets=np.zeros((len(rows),))
    for j,row in enumerate(rows):
        indices = range(row-lookback,row,1)
        samples[j]=data[indices]
        targets[j]=data[row+delay][k]
    return samples,targets
注意力机制实现
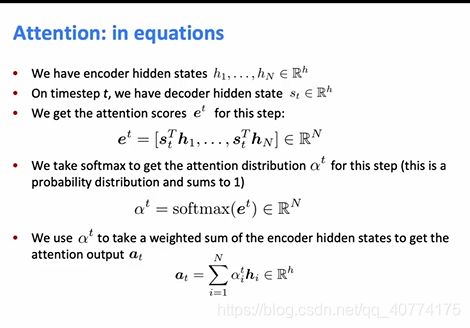
由于本次实验不使用解码器,因此直接使用编码器最后一步的输出h与前T个时间步的隐含层hi做点积来计算attention_score。这样做的效果其实等价于加强对最后一个时间步的关注。
下面是具体的代码实现:
from tensorflow.keras.layers import Dense, Lambda, dot, Activation, concatenate ,LSTM
import keras.backend as K

# 注意力,增加对最后一个时间步长的关注

def attention_3d_block(hidden_states):
    print('hidden_states: ',hidden_states.shape)  # b_z*20*32  一个三维的tensor,批量大小*T个时间步长*每个时间步长输出的h大小
    # hidden_states.shape = (batch_size, time_steps, hidden_size)
    hidden_size = int(hidden_states.shape[2])
    # Inside dense layer
    #              hidden_states            dot               W            =>           score_first_part
    # (batch_size, time_steps, hidden_size) dot (hidden_size, hidden_size) => (batch_size, time_steps, hidden_size)
    # W is the trainable weight matrix of attention Luong's multiplicative style score
    score_first_part = Dense(hidden_size, use_bias=False, name='attention_score_vec')(hidden_states) # 进行一次全连接,本质上没有太大意义,只是为了增加一下模型复杂度,
    #--并且改变一下前T个时间步的特征表示,这里其实也可以不进行全连接,直接使用hidden_states
    print('score_first_part ',score_first_part.shape) # b_z*20*32
    #            score_first_part           dot        last_hidden_state     => attention_weights
    # (batch_size, time_steps, hidden_size) dot   (batch_size, hidden_size)  => (batch_size, time_steps)
    h_t = Lambda(lambda x: x[:, -1, :], output_shape=(hidden_size,), name='last_hidden_state')(hidden_states) # 取出最后一个时间步的特征
    print(h_t.shape) # 相当于取了最后一个时间步长?
    score = dot([score_first_part, h_t], [2, 1], name='attention_score') # 将最后一个时间步长与前T个时间步长进行点积
    print('score ',score.shape)  # 1*T
    attention_weights = Activation('softmax', name='attention_weight')(score)  # 求权重
    print('attention_weights ',attention_weights.shape)# 1*20
    # (batch_size, time_steps, hidden_size) dot (batch_size, time_steps) => (batch_size, hidden_size)
    context_vector = dot([hidden_states, attention_weights], [1, 1], name='context_vector') # 加权
    print('context_vector', context_vector.shape) # 20*32  dot 20 == 32
    pre_activation = concatenate([context_vector, h_t], name='attention_output') # 再次将最后一个时间步的信息加入,本质上是一个残差连接,这步可以省略
    print('pre_activation ',pre_activation.shape) # 32+32
    attention_vector = Dense(128, use_bias=False, activation='tanh', name='attention_vector')(pre_activation) # 用一个全连接层进行合并
    print('attention_vector ',attention_vector.shape)
    return attention_vector
模型搭建
from tensorflow.keras import Input, Model
def get_model():
    inputs = Input(shape=(10, 9,))
    rnn_out = LSTM(32, return_sequences=True)(inputs)
    attention_output = attention_3d_block(rnn_out)
    output = Dense(1)(attention_output)
    m = Model(inputs,output)
    print(m.summary())
    return m

# from keras.layers.core import Dense, Activation, Dropout
# from keras.layers.recurrent import LSTM
# from keras.models import Sequential
step = 4
delay = 1 # 延迟1天
batch_size = 64  # 每一,有64组数据
lookback = 10  # 往回看10天
k=0 # k=0时,预测收盘价,k==5时预测涨跌
# model = Sequential()
# model.add(LSTM(128,input_shape=(None,float_data.shape[-1])))
# #model.add(LSTM(16))
# model.add(Dense(1))
model = get_model()
model.compile(loss="mse", optimizer="rmsprop",metrics=['acc'])
train_y,target_y = g_data(float_data,lookback=lookback,step=step, delay=delay,k=k)
history = model.fit(train_y,target_y,epochs=100,validation_split=0.15,batch_size=batch_size)

loss = history.history['loss']
print(loss)
val_loss = history.history['val_loss']
ep = range(1,len(loss)+1)
plt.plot(ep, loss, 'bo', label='Training loss')
plt.plot(ep, val_loss, 'b', label='Validation loss')
plt.title('Training and validation loss')
plt.legend()
plt.show()
绘制图像
# 绘制图像
def plot_results(predicted_data, true_data):
    plt.plot(true_data, 'o-',label='True Data')
    plt.plot(predicted_data,'*-', label='Prediction')
   # plt.vlines(0, 0, 0.5, colors = "r", linestyles = "dashed")
    plt.legend()
    plt.axhline(y=0,ls=":",c="black")#添加水平直线
    plt.show()
预测
test_x,test_y = g_test(float_data,10,4,1,k=k)

print(test_x.shape)
predicted = model.predict(test_x)
plot_results(predicted,test_y)
查看attention权重
基本函数
def get_activations(model, inputs, print_shape_only=False, layer_name=None):
    # Documentation is available online on Github at the address below.
    # From: https://github.com/philipperemy/keras-visualize-activations
#    print('----- activations -----')
   #  print(model)
    activations = []
    inp = model.input
    #print(inp.shape)
    if layer_name is None:
        outputs = [layer.output for layer in model.layers]
    else:
        outputs = [layer.output for layer in model.layers if layer.name == layer_name]  # all layer outputs
    funcs = [K.function([inp] + [K.learning_phase()], [out]) for out in outputs]  # evaluation functions
    layer_outputs = [func([inputs, 1])[0] for func in funcs]
    for layer_activations in layer_outputs:
        activations.append(layer_activations)
#        if print_shape_only:
#            print(layer_activations.shape)
#        else:
#            print(layer_activations)
    return activations
调用
import pandas as pd
attention_vectors = []
tmp = get_activations(model,test_x,print_shape_only=True,layer_name='attention_weight')
print(tmp[0].shape)
attention_vector = np.mean(get_activations(model,test_x,print_shape_only=True,layer_name='attention_weight')[0], axis=0).squeeze()
#print(attention_vector.shape)
# 对各列求平均值后 ,为1*10,然后删除第1个维度,最后变成(10,)
    # plot part.

for i in attention_vector:
    print(i)
pd.DataFrame(attention_vector, columns=['attention (%)']).plot(kind='bar',
                                                                         title='Attention Mechanism as '
                                                                               'a function of input'
                                                                               ' dimensions.')
plt.show()

