DBSCAN方法及其应用
- DBSCAN密度聚类
- 举例
- 应用实例
- 数据实例
- DBSCAN主要参数
- 根据上网时间聚类
- 输出
- 根据上网时长聚类
- 输出
- 技巧
1. DBSCAN密度聚类
- DBSCAN算法是一种基于密度的聚类算法。
- 聚类的时候不需要预先指定簇的个数。
- 最终的簇的个数不定。
DBSCAN算法将数据点分为三类。
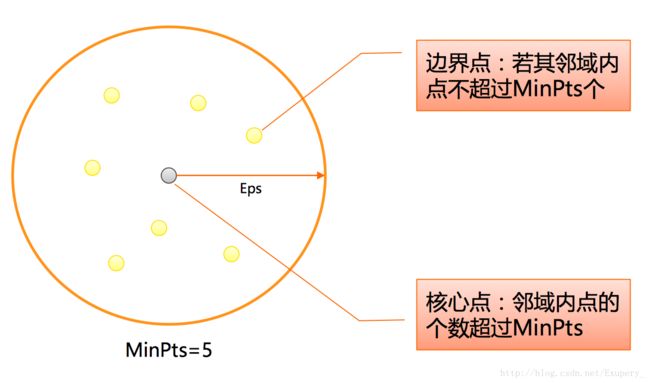
- 核心点:在半径Eps内含有超过MinPts数目的点。
- 边界点:在半径Eps内点的数目小于MinPts,但是落在核心点的临域内。
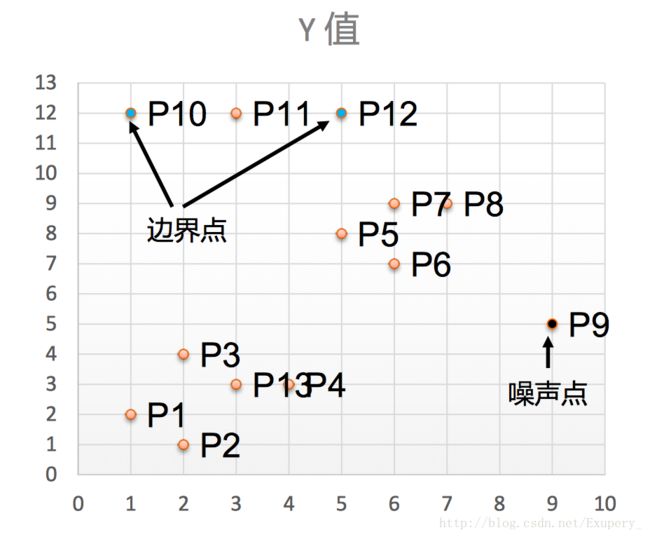
- 噪音点:既不是核心点也不是边界点的点。
DBSCAN算法流程
- 将所有点标记为核心点、边界点或噪声点。
- 删除噪声点。
- 为距离在Eps之内的所有核心点之间赋予一条边。
- 每组连通的核心点形成一个簇。
- 将每个边界点指派到一个与之关联的核心点的簇中(哪一个核心点的半径范围之内)。
2. 举例
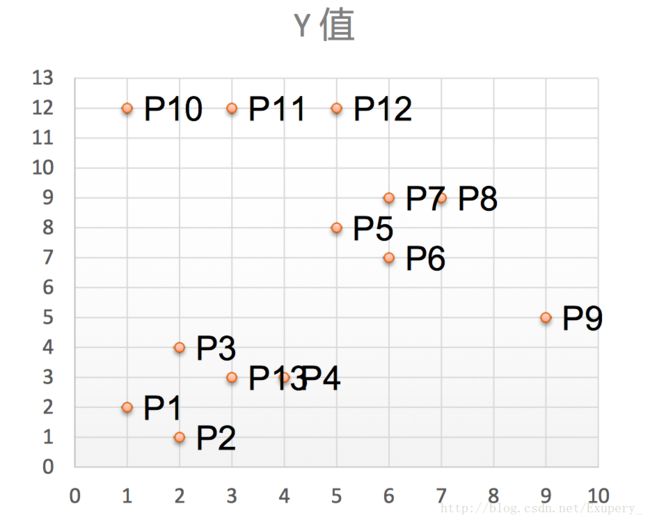
有如下13个样本点,使用DBSCAN进行聚类。
取Eps=3,MinPts=3,依 据DBSACN对所有点进行聚类 (曼哈顿距离)。
- 对每个点计算其邻域Eps=3内的点的集合。
- 集合内点的个数超过MinPts=3的点为核心点。
- 查看剩余点是否在核心点的邻域内,若在,则为边界点,否则为噪声点。
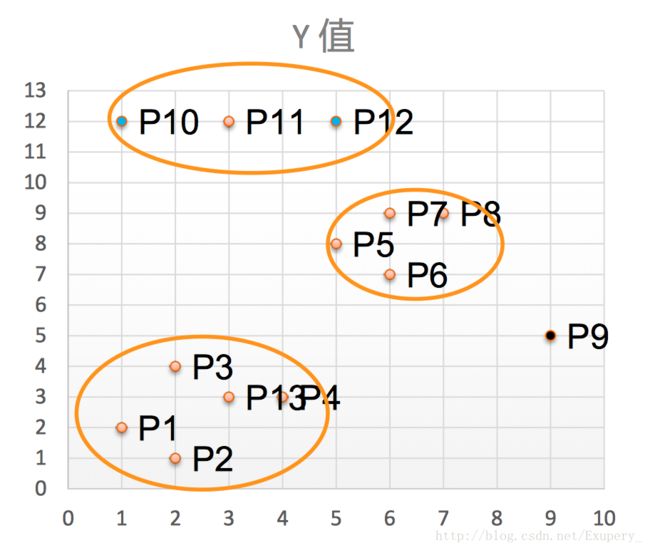
将距离不超过Eps=3的点相互连接,构成一个簇,核心点邻域内的点也会被加入到这个簇中。 则形成3个簇。
应用实例
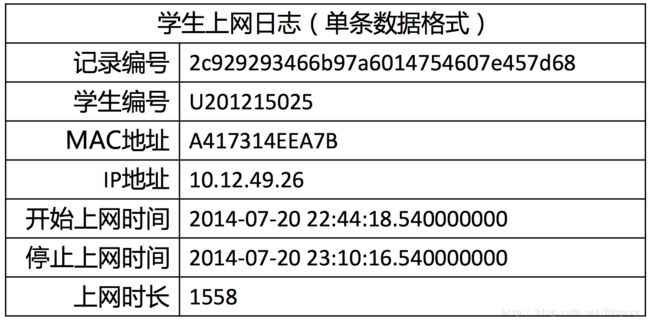
现有大学校园网的日志数据,290条大学生的校园网使用情况数据,数据包 括用户ID,设备的MAC地址,IP地址,开始上网时间,停止上网时间,上 网时长,校园网套餐等。利用已有数据,分析学生上网的模式。目的:通过DBSCAN聚类,分析学生上网时间和上网时长的模式。
数据实例
数据链接
DBSCAN主要参数
eps:两个样本被看作邻居节点的最大距离。min_sample:簇的样本数。metric:距离计算方式。
根据上网时间聚类
import numpy as np
import sklearn.cluster as skc
from sklearn import metrics
import matplotlib.pyplot as plt
import sklearn.cluster as skc
from sklearn import metrics
import matplotlib.pyplot as plt
mac2id = dict()
online_times = []
#f = open('E:/Anaconda/DATA/TestData.txt', encoding='utf-8')
f = open('E:/Anaconda/DATA/TestData.txt','r')
for line in f:
online_times = []
#f = open('E:/Anaconda/DATA/TestData.txt', encoding='utf-8')
f = open('E:/Anaconda/DATA/TestData.txt','r')
for line in f:
# 读取每条数据中的mac地址,
# 开始上网时间,上网时长
# 开始上网时间,上网时长
mac = line.split(',')[2]
online_time = int(line.split(',')[6])
start_time = int(line.split(',')[4].split(' ')[1].split(':')[0])
online_time = int(line.split(',')[6])
start_time = int(line.split(',')[4].split(' ')[1].split(':')[0])
# mac2id是一个字典:
# key是mac地址
# value是对应mac地址的上网时长以及开始上网时间(精度为小时)
# key是mac地址
# value是对应mac地址的上网时长以及开始上网时间(精度为小时)
if mac not in mac2id:
mac2id[mac] = len(online_times)
online_times.append((start_time, online_time))
else:
online_times[mac2id[mac]] = [(start_time, online_time)]
mac2id[mac] = len(online_times)
online_times.append((start_time, online_time))
else:
online_times[mac2id[mac]] = [(start_time, online_time)]
# -1:根据元素的个数自动计算此轴的长度
# X:上网时间
real_X = np.array(online_times).reshape((-1, 2))
X = real_X[:, 0:1]
# X:上网时间
real_X = np.array(online_times).reshape((-1, 2))
X = real_X[:, 0:1]
# 调用DBSCAN方法进行训练,
# labels为每个数据的簇标签
# labels为每个数据的簇标签
db = skc.DBSCAN(eps=0.01, min_samples=20).fit(X)
labels = db.labels_
labels = db.labels_
# 打印数据被记上的标签,
# 计算标签为-1,即噪声数据的比例。
# 计算标签为-1,即噪声数据的比例。
print('Labels:')
print(labels)
raito = len(labels[labels[:] == -1]) / len(labels)
print('Noise raito:', format(raito, '.2%'))
print(labels)
raito = len(labels[labels[:] == -1]) / len(labels)
print('Noise raito:', format(raito, '.2%'))
# 计算簇的个数并打印,评价聚类效果
n_clusters_ = len(set(labels)) - (1 if -1 in labels else 0)
print('Estimated number of clusters: %d' % n_clusters_)
print("Silhouette Coefficient: %0.3f" % metrics.silhouette_score(X, labels))
print('Estimated number of clusters: %d' % n_clusters_)
print("Silhouette Coefficient: %0.3f" % metrics.silhouette_score(X, labels))
# 打印各簇标号以及各簇内数据
for i in range(n_clusters_):
print('Cluster ', i, ':')
print(list(X[labels == i].flatten()))
print('Cluster ', i, ':')
print(list(X[labels == i].flatten()))
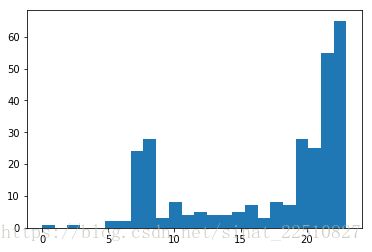
# 画直方图,分析实验结果
plt.hist(X, 24)
plt.show()
plt.show()
输出:
Labels:
[ 0 -1 0 1 -1 1 0 1 2 -1 1 0 1 1 3 -1 -1 3 -1 1 1 -1 1 3 4
-1 1 1 2 0 2 2 -1 0 1 0 0 0 1 3 -1 0 1 1 0 0 2 -1 1 3
1 -1 3 -1 3 0 1 1 2 3 3 -1 -1 -1 0 1 2 1 -1 3 1 1 2 3 0
1 -1 2 0 0 3 2 0 1 -1 1 3 -1 4 2 -1 -1 0 -1 3 -1 0 2 1 -1
-1 2 1 1 2 0 2 1 1 3 3 0 1 2 0 1 0 -1 1 1 3 -1 2 1 3
1 1 1 2 -1 5 -1 1 3 -1 0 1 0 0 1 -1 -1 -1 2 2 0 1 1 3 0
0 0 1 4 4 -1 -1 -1 -1 4 -1 4 4 -1 4 -1 1 2 2 3 0 1 0 -1 1
0 0 1 -1 -1 0 2 1 0 2 -1 1 1 -1 -1 0 1 1 -1 3 1 1 -1 1 1
0 0 -1 0 -1 0 0 2 -1 1 -1 1 0 -1 2 1 3 1 1 -1 1 0 0 -1 0
0 3 2 0 0 5 -1 3 2 -1 5 4 4 4 -1 5 5 -1 4 0 4 4 4 5 4
4 5 5 0 5 4 -1 4 5 5 5 1 5 5 0 5 4 4 -1 4 4 5 4 0 5
4 -1 0 5 5 5 -1 4 5 5 5 5 4 4]
Noise raito: 22.15%
Estimated number of clusters: 6
Silhouette Coefficient: 0.710
Cluster 0 :
[22, 22, 22, 22, 22, 22, 22, 22, 22, 22, 22, 22, 22, 22, 22, 22, 22, 22, 22, 22, 22, 22, 22, 22, 22, 22, 22, 22, 22, 22, 22, 22, 22, 22, 22, 22, 22, 22, 22, 22, 22, 22, 22, 22, 22, 22, 22, 22, 22, 22, 22, 22, 22, 22, 22]
Cluster 1 :
[23, 23, 23, 23, 23, 23, 23, 23, 23, 23, 23, 23, 23, 23, 23, 23, 23, 23, 23, 23, 23, 23, 23, 23, 23, 23, 23, 23, 23, 23, 23, 23, 23, 23, 23, 23, 23, 23, 23, 23, 23, 23, 23, 23, 23, 23, 23, 23, 23, 23, 23, 23, 23, 23, 23, 23, 23, 23, 23, 23, 23, 23, 23, 23, 23]
Cluster 2 :
[20, 20, 20, 20, 20, 20, 20, 20, 20, 20, 20, 20, 20, 20, 20, 20, 20, 20, 20, 20, 20, 20, 20, 20, 20, 20, 20, 20]
Cluster 3 :
[21, 21, 21, 21, 21, 21, 21, 21, 21, 21, 21, 21, 21, 21, 21, 21, 21, 21, 21, 21, 21, 21, 21, 21, 21]
Cluster 4 :
[8, 8, 8, 8, 8, 8, 8, 8, 8, 8, 8, 8, 8, 8, 8, 8, 8, 8, 8, 8, 8, 8, 8, 8, 8, 8, 8, 8]
Cluster 5 :
[7, 7, 7, 7, 7, 7, 7, 7, 7, 7, 7, 7, 7, 7, 7, 7, 7, 7, 7, 7, 7, 7, 7, 7]
根据上网时长聚类
import numpy as np
import sklearn.cluster as skc
from sklearn import metrics
import matplotlib.pyplot as plt
import sklearn.cluster as skc
from sklearn import metrics
import matplotlib.pyplot as plt
mac2id = dict()
online_times = []
f = open('E:/Anaconda/DATA/TestData.txt', 'r')
for line in f:
online_times = []
f = open('E:/Anaconda/DATA/TestData.txt', 'r')
for line in f:
# 读取每条数据中的mac地址,
# 开始上网时间,上网时长
# 开始上网时间,上网时长
mac = line.split(',')[2]
online_time = int(line.split(',')[6])
start_time = int(line.split(',')[4].split(' ')[1].split(':')[0])
online_time = int(line.split(',')[6])
start_time = int(line.split(',')[4].split(' ')[1].split(':')[0])
# mac2id是一个字典:
# key是mac地址
# value是对应mac地址的上网时长以及开始上网时间(精度为小时)
# key是mac地址
# value是对应mac地址的上网时长以及开始上网时间(精度为小时)
if mac not in mac2id:
mac2id[mac] = len(online_times)
online_times.append((start_time, online_time))
else:
online_times[mac2id[mac]] = [(start_time, online_time)]
mac2id[mac] = len(online_times)
online_times.append((start_time, online_time))
else:
online_times[mac2id[mac]] = [(start_time, online_time)]
# -1:根据元素的个数自动计算此轴的长度
# X:上网时间
real_X = np.array(online_times).reshape((-1, 2))
X = np.log(1 + real_X[:, 1:])
# X:上网时间
real_X = np.array(online_times).reshape((-1, 2))
X = np.log(1 + real_X[:, 1:])
# 调用DBSCAN方法进行训练 ,
# labels为每个数据的簇标签
# labels为每个数据的簇标签
db = skc.DBSCAN(eps=0.14, min_samples=10).fit(X)
labels = db.labels_
labels = db.labels_
print('Lables:')
print(labels)
raito = len(labels[labels[:] == -1]) / len(labels)
print('Noise raito:', format(raito, '.2%'))
print(labels)
raito = len(labels[labels[:] == -1]) / len(labels)
print('Noise raito:', format(raito, '.2%'))
# Number of cluster in lables, ignoring noise if present.
n_clusters_ = len(set(labels)) - (1 if -1 in labels else 0)
n_clusters_ = len(set(labels)) - (1 if -1 in labels else 0)
print('Estimated number of clusters: %d' % n_clusters_)
print('Silhouette Coefficient: %0.3f' % metrics.silhouette_score(X, labels))
print('Silhouette Coefficient: %0.3f' % metrics.silhouette_score(X, labels))
# 统计每一个簇内的样本个数 , 均值,标准差
for i in range(n_clusters_):
print('Cluster ', i, ':')
count = len(X[labels == i])
mean = np.mean(real_X[labels == i][:, 1])
std = np.std(real_X[labels == i][:, 1])
print('\t number of sample: ', count)
print('\t mean of sample : ', format(mean, '.1f'))
print('\t std of sample : ', format(std, '.1f'))
print('Cluster ', i, ':')
count = len(X[labels == i])
mean = np.mean(real_X[labels == i][:, 1])
std = np.std(real_X[labels == i][:, 1])
print('\t number of sample: ', count)
print('\t mean of sample : ', format(mean, '.1f'))
print('\t std of sample : ', format(std, '.1f'))
输出
Lables:
[ 0 1 0 4 1 2 0 2 0 3 -1 0 -1 -1 0 3 1 0 3 2 2 1 2 0 1
1 -1 -1 0 0 0 0 1 0 -1 0 0 0 2 0 1 0 -1 -1 0 0 0 3 2 0
-1 1 0 1 0 0 -1 2 0 0 0 1 3 3 0 2 0 -1 3 0 0 2 0 0 0
2 1 -1 0 0 0 0 0 0 1 -1 0 3 1 0 1 1 0 1 0 1 0 0 -1 1
1 0 0 2 0 0 0 2 2 0 0 0 -1 0 0 4 0 1 2 -1 0 1 0 2 0
-1 -1 -1 0 1 1 3 -1 0 1 0 2 0 0 2 1 1 0 0 0 0 4 -1 0 0
0 0 2 0 0 0 0 -1 2 0 0 0 0 4 0 0 -1 0 2 0 0 -1 0 1 4
0 0 -1 1 1 0 0 2 0 0 3 -1 -1 -1 1 0 0 2 1 0 -1 -1 3 2 2
0 0 3 0 1 0 0 0 3 2 0 -1 0 1 -1 -1 0 2 2 1 4 0 0 1 0
2 0 0 0 0 1 1 0 0 1 0 4 -1 -1 0 0 0 -1 -1 1 -1 4 -1 0 2
2 -1 2 1 2 -1 0 -1 0 2 2 1 -1 0 1 2 -1 -1 1 -1 2 -1 -1 1 4
2 3 1 0 4 0 0 4 2 4 0 0 2 -1]
Noise raito: 16.96%
Estimated number of clusters: 5
Silhouette Coefficient: 0.227
Cluster 0 :
number of sample: 128
mean of sample : 5864.3
std of sample : 3498.1
Cluster 1 :
number of sample: 46
mean of sample : 36835.1
std of sample : 11314.1
Cluster 2 :
number of sample: 40
mean of sample : 843.2
std of sample : 242.9
Cluster 3 :
number of sample: 14
mean of sample : 16581.6
std of sample : 1186.7
Cluster 4 :
number of sample: 12
mean of sample : 338.4
std of sample : 31.9
