用keras的神经网络实现二分类的小项目
这次算是完整滴做了一个深度学习的小项目,还是非常有意思的。
historical和active的csv文件可以在下方链接的github里读取,源码和各种数据源文件都在github链接里。
源码和csv数据链接
https://github.com/kr-li/NN_Model
最近帮同学做了个小项目,有一批historical的销售数据,有商品的各种特性,以及他们是否卖了出去的数据。
我们通过keras的Dense来搭建一个神经网络,来训练和测试这些数据,本质上是一个二分类问题,标签是1和0代表是否卖了出去。
之后保存这个训练后的model,运用这个model去预测一批新的active商品数据,来预测他们是否能够卖出去,做一个分类出来。
其中涉及了一些csv读取数据以后对数据进行处理的内容
整体代码在下面
#!/usr/bin/env python3
# -*- coding: utf-8 -*-

# data standardisation
from sklearn import preprocessing

# data splitting
from sklearn.model_selection import train_test_split

# keras for nn building
from keras.models import Sequential, load_model

# a dense network
from keras.layers import Dense, Dropout

# import the numpy library
import numpy as np

# to plot error
import matplotlib.pyplot as plt

# pandas for data analysis
import pandas as pd

# confusion matrix from scikit learn
from sklearn.metrics import confusion_matrix

# for visualisation
import seaborn as sns

# for roc-curve
from sklearn.metrics import roc_curve

import seaborn as sns
sns.set()


# preparing the data
# read data
df_historical = pd.read_csv('HistoricalData.csv')

df_historical.head()

# are there any missing values
print(df_historical.isnull().any())

# descriptives
df_historical.describe()

# define a new matrix only with valuable numbners
df_historical = df_historical.iloc [:,4:13]
print (df_historical)

df_historical.describe()

print("Number of rows with 0 values for each variable")
for col in df_historical.columns:
    missing_rows = df_historical.loc[df_historical[col]==0].shape[0]
    print(col + ": " + str(missing_rows))

#删除这三列中有0的行
df_historical = df_historical[~df_historical['PriceReg'].isin([0])]
df_historical = df_historical[~df_historical['DiscountedPrice'].isin([0])]
df_historical = df_historical[~df_historical['PromotionPrice'].isin([0])]


# check zeros again
print("Number of rows with 0 values for each variable")
for col in df_historical.columns:
    missing_rows = df_historical.loc[df_historical[col]==0].shape[0]
    print(col + ": " + str(missing_rows))

#删除price小于discount和promotion的行
df_historical = df_historical.drop(df_historical[df_historical['PriceReg'] < df_historical['DiscountedPrice']].index)
df_historical = df_historical.drop(df_historical[df_historical['PriceReg'] < df_historical['PromotionPrice']].index)


# check zeros again
print("Number of rows with 0 values for each variable")
for col in df_historical.columns:
    missing_rows = df_historical.loc[df_historical[col]==0].shape[0]
    print(col + ": " + str(missing_rows))

#dataframe重排索引index
df_historical = df_historical.reset_index(drop=True)
# scale data
df_scaled = preprocessing.scale(df_historical)

# convert back to data frame
df_scaled = pd.DataFrame(df_scaled, columns=df_historical.columns)

# check that scaling worked
df_scaled.describe()

# outcome to be binary
df_scaled['SoldFlag'] = df_historical['SoldFlag']
df_historical2 = df_scaled

# assign features and target
X = df_historical2.loc[:, df_historical2.columns != 'SoldFlag']
y = df_historical2.loc[:, 'SoldFlag']

# split train and test
X_train, X_test, y_train, y_test = train_test_split(X, y, test_size=0.2)

# split train and validate
X_train, X_val, y_train, y_val = train_test_split(X_train, y_train, test_size=0.2)


# building the nn
model = Sequential()


# Add the first hidden layer
model.add(Dense(32, activation='relu', input_dim=8))

# Add the second hidden layer
model.add(Dense(16, activation='relu'))

# Add the third hidden layer
#model.add(Dense(16, activation='relu'))

# Add the output layer
model.add(Dense(1, activation='sigmoid'))

# avoid overfitting
#model.add(Dropout(0.5))

# Compile the model
model.compile(optimizer='adam',
              loss='binary_crossentropy',
              metrics=['accuracy'])

#fit
history = model.fit(X_train, y_train, epochs=200, validation_data=(X_val, y_val))


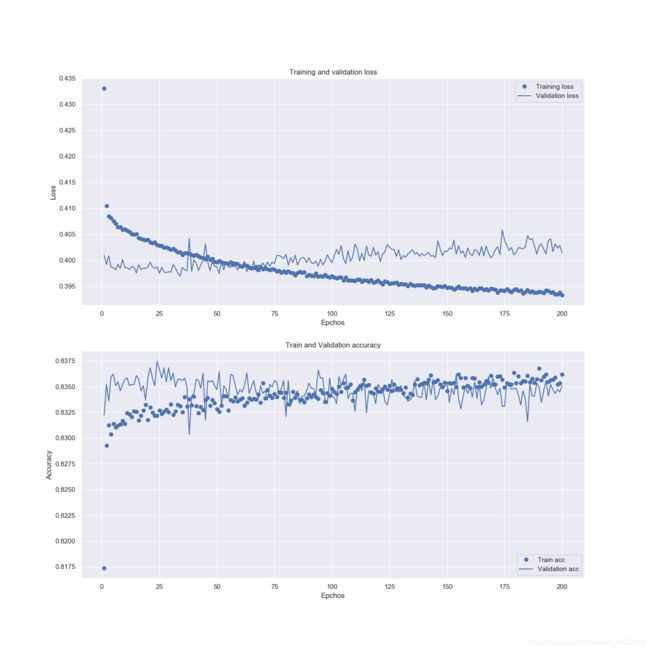
# loss图
plt.figure(figsize=(15,15))
ax = plt.subplot(211)
loss = history.history['loss']
val_loss = history.history['val_loss']
epchos = range(1, len(loss) + 1)
ax.plot(epchos, loss, 'bo', label='Training loss')
ax.plot(epchos, val_loss, 'b', label='Validation loss')
ax.set_title('Training and validation loss')
ax.set_xlabel('Epchos')
ax.set_ylabel('Loss')
plt.legend()

#acc图
ax = plt.subplot(212)
acc = history.history['accuracy']
val_acc = history.history['val_accuracy']
epchos2 = range(1, len(acc) + 1)
ax.plot(epchos2, acc, 'bo', label='Train acc')
ax.plot(epchos2, val_acc, 'b', label='Validation acc')
ax.set_title('Train and Validation accuracy')
ax.set_xlabel('Epchos')
ax.set_ylabel('Accuracy')
plt.legend()
plt.savefig('model loss and accuracy.png')


# testing accuracy
scores = model.evaluate(X_train, y_train)
print("Training Accuracy: %.2f%%\n" % (scores[1]*100))

scores = model.evaluate(X_test, y_test)
print("Testing Accuracy: %.2f%%\n" % (scores[1]*100))

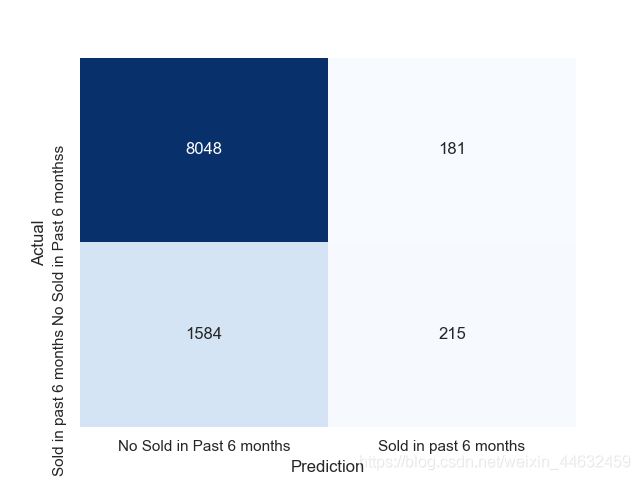
# confusion matrix
plt.figure()
y_test_pred = model.predict_classes(X_test)
c_matrix = confusion_matrix(y_test, y_test_pred)
ax = sns.heatmap(c_matrix,  annot=True, fmt="d",
                 xticklabels=['No Sold in Past 6 months', 'Sold in past 6 months'],
                 yticklabels=['No Sold in Past 6 monthss', 'Sold in past 6 months'],
                 cbar=False, cmap='Blues')
ax.set_xlabel("Prediction")
ax.set_ylabel("Actual")
plt.savefig('confusion matrix.png')

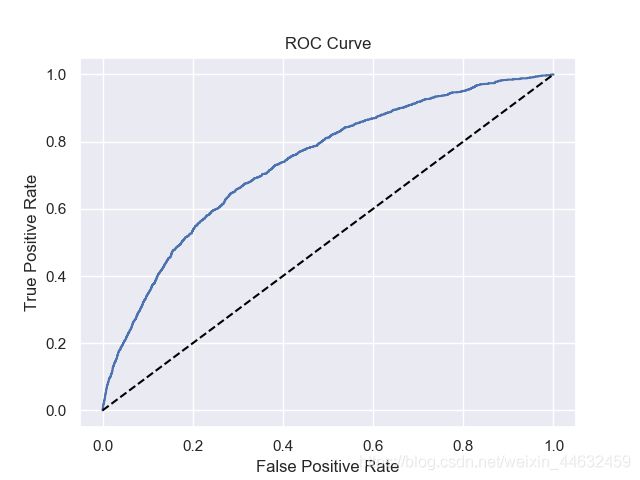
#roc图
y_test_pred_probs = model.predict(X_test)
FPR, TPR, _ = roc_curve(y_test, y_test_pred_probs)
plt.figure()
plt.plot(FPR, TPR)
plt.plot([0,1],[0,1],'--', color='black') #diagonal line
plt.title('ROC Curve')
plt.xlabel('False Positive Rate')
plt.ylabel('True Positive Rate')
plt.savefig('roc.png')


# serialize model to JSON
model_json = model.to_json()
with open("Historical.json", "w") as json_file:
    json_file.write(model_json)
# serialize weights to HDF5
model.save("Historical.h5")
print("Saved model to disk")


#import the Activedata
df_activeData = pd.read_csv('ActiveData.csv')

df_activeData.head()

# are there any missing values
print(df_activeData.isnull().any())

# descriptives
df_activeData.describe()

# define a new matrix only with valuable numbners
df_activeData = df_activeData.iloc [:,4:12]
print (df_activeData)

df_activeData.describe()

print("Number of rows with 0 values for each variable")
for col in df_activeData.columns:
    missing_rows = df_activeData.loc[df_activeData[col]==0].shape[0]
    print(col + ": " + str(missing_rows))

#删除这几列中有0的行
df_activeData = df_activeData[~df_activeData['PriceReg'].isin([0])]
df_activeData = df_activeData[~df_activeData['DiscountedPrice'].isin([0])]
df_activeData = df_activeData[~df_activeData['PromotionPrice'].isin([0])]
df_activeData = df_activeData[~df_activeData['ReleaseYear'].isin([0])]
df_activeData = df_activeData[~df_activeData['ItemCount'].isin([0])]

# check zeros again
print("Number of rows with 0 values for each variable")
for col in df_activeData.columns:
    missing_rows = df_activeData.loc[df_activeData[col]==0].shape[0]
    print(col + ": " + str(missing_rows))

#删除price小于discount和promotion的行
df_activeData = df_activeData.drop(df_activeData[df_activeData['PriceReg'] < df_activeData['DiscountedPrice']].index)
df_activeData = df_activeData.drop(df_activeData[df_activeData['PriceReg'] < df_activeData['PromotionPrice']].index)


# check zeros again
print("Number of rows with 0 values for each variable")
for col in df_activeData.columns:
    missing_rows = df_activeData.loc[df_activeData[col]==0].shape[0]
    print(col + ": " + str(missing_rows))

#dataframe重排索引index
df_activeData = df_activeData.reset_index(drop=True)
# scale data
df_scaled = preprocessing.scale(df_activeData)

# convert back to data frame
df_scaled = pd.DataFrame(df_scaled, columns=df_activeData.columns)

# check that scaling worked
df_scaled.describe()

df_activeData2 = df_scaled

model = load_model("Historical.h5")

y_Active_pred = model.predict_classes(df_activeData2)
print (y_Active_pred)

y_Active_pred_probs = model.predict(df_activeData2)


df_activeData['SoldFlag'] = y_Active_pred
df_activeData['Probability'] = y_Active_pred_probs
df_activeData.to_csv('data1.csv')


'''
indices = [i for i, value in enumerate(predict) if predict[i] != 1]
Sold_True = [df_activeData[i] for i in indices]
print ('Sold_True')
'''


