ggplot2 |legend参数设置,图形精雕细琢
本文首发于微信公众号“生信补给站”,https://mp.weixin.qq.com/s/A5nqo6qnlt_5kF3_GIrjIA
学习了ggplot2|详解八大基本绘图要素后,就可以根据自己的需要绘制图形。前面也给出了一些ggplot2绘制生信分析基本图形的例子
pheatmap|暴雨暂歇,“热图”来袭!!!
ggplot2-plotly|让你的火山图“活”过来
ggplot2|扩展包从0开始绘制雷达图
ggplot2| 绘制KEGG气泡图
ggplot2|绘制GO富集柱形图
ggplot2|从0开始绘制PCA图
ggplot2|ggpubr进行“paper”组图合并
本文将介绍一些对legend的细节操作来完成图形的“精雕细琢”。
载入R包和数据
mtcars数据集作为示例数据
library(ggplot2)#查看数据集
head(mtcars)
# 将cyl gear变量转为因子变量
mtcars$cyl<-as.factor(mtcars$cyl)
mtcars$gear <- as.factor(mtcars$gear)
绘制基本图形
#gear为横坐标,对mpg做箱线图,gear填充颜色
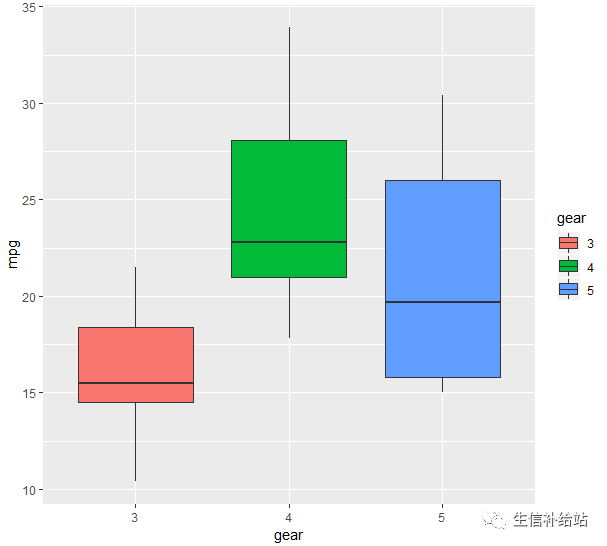
p <- ggplot(mtcars, aes(x=gear, y=mpg, fill=gear)) + geom_boxplot()
p
设置 legend position
使用 theme() 参数设置legend位置
# 可选参数为“left”,“top”, “right”, “bottom”.
p + theme(legend.position="bottom")
# 数值向量 c(x,y) 调控位置
p + theme(legend.position = c(0.8, 0.2))
[外链图片转存失败(img-xBOTOPCv-1566272187863)(data:image/gif;base64,iVBORw0KGgoAAAANSUhEUgAAAAEAAAABCAYAAAAfFcSJAAAADUlEQVQImWNgYGBgAAAABQABh6FO1AAAAABJRU5ErkJggg==)]
更改legend 的title , font styles
# legend title
p + theme(legend.title = element_text(colour="blue", size=10,                                     face="bold"))
# legend labels
p + theme(legend.text = element_text(colour="blue", size=10,                                    face="bold"))
[外链图片转存失败(img-oCje3zIL-1566272187865)(data:image/gif;base64,iVBORw0KGgoAAAANSUhEUgAAAAEAAAABCAYAAAAfFcSJAAAADUlEQVQImWNgYGBgAAAABQABh6FO1AAAAABJRU5ErkJggg==)]
设置 legend 背景色
#fill设置legend box背景色,colour设置边框颜色
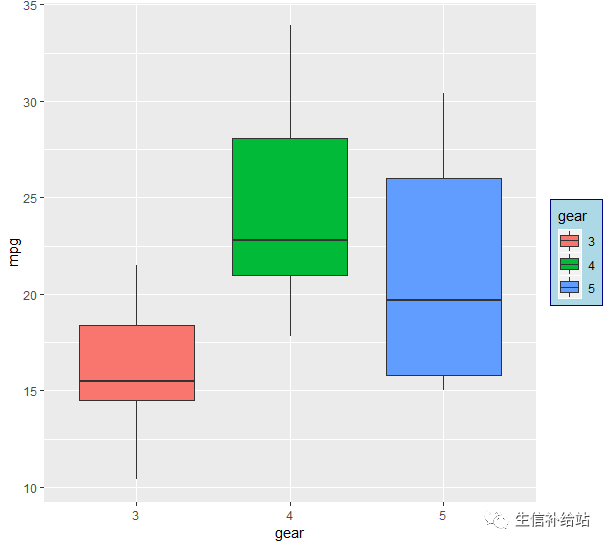
p + theme(legend.background = element_rect(fill="lightblue",                                 size=0.5, linetype="solid",
	colour ="darkblue"))
设置legend items顺序
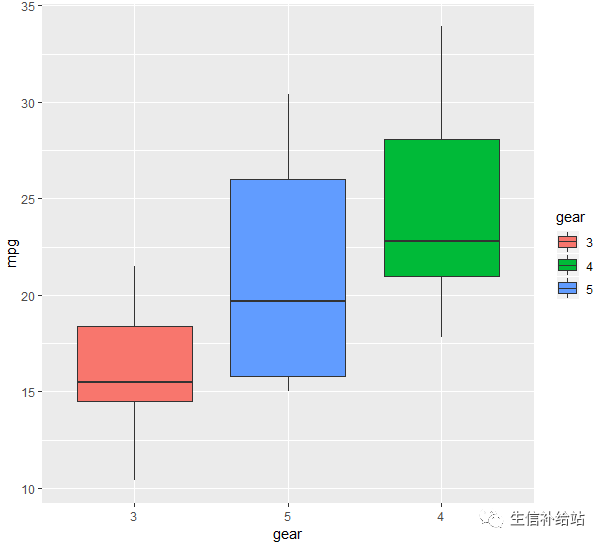
scale_x_discrete自定义设置顺序
p + scale_x_discrete(limits=c("3", "5", "4"))
去除legend
# 去除legend title
p + theme(legend.title = element_blank())
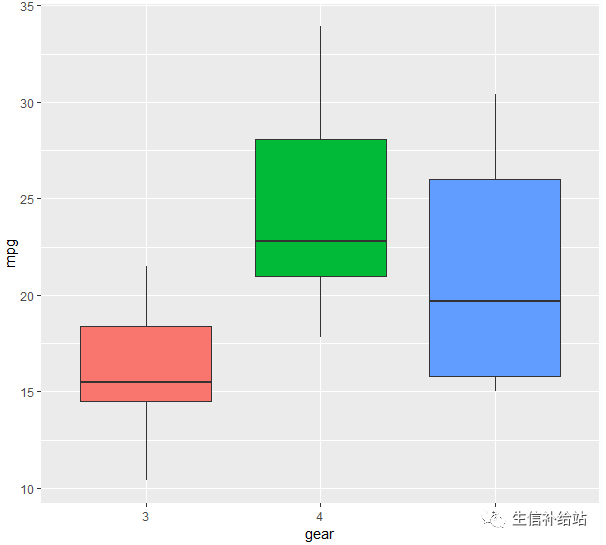
# 去除整个legend
p + theme(legend.position='none')
guides 设置specific aesthetic
使用**guides()**参数来设置或移除特定的美学映射(fill, color, size, shape等).
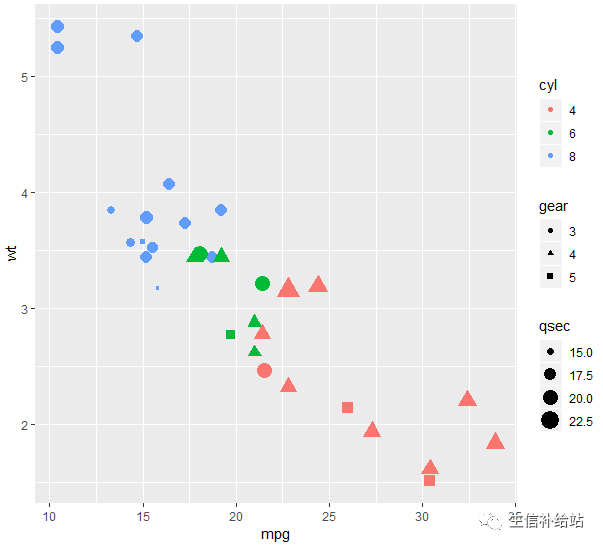
因子变量cyl和gear映射为点图的颜色和形状,qsec决定点的大小。
p <- ggplot(data = mtcars,   aes(x=mpg, y=wt, color=cyl, size=qsec, shape=gear))+   geom_point()
# 不设定specific aesthetic时候
p
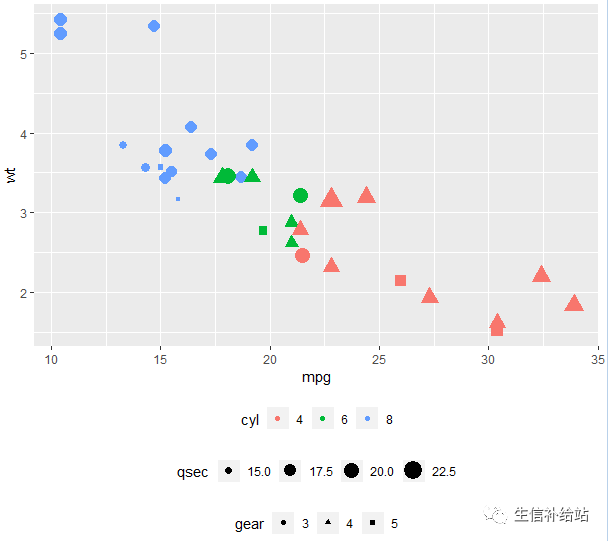
设置多个legend的位置
# 更改 legend position
p +theme(legend.position="bottom")
# Horizontal legend box
p +theme(legend.position="bottom", legend.box = "")
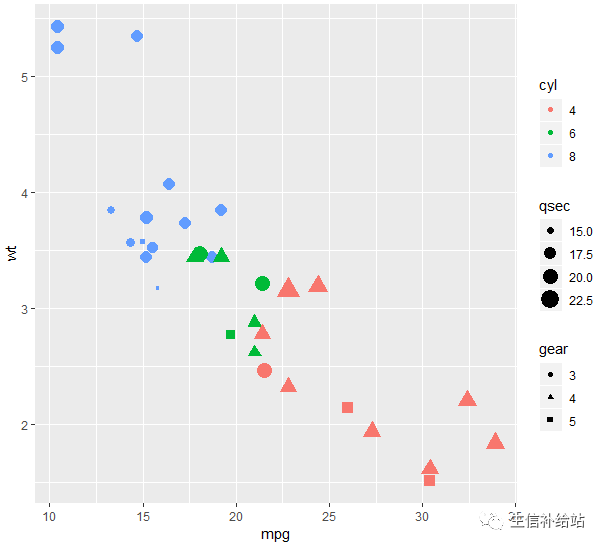
设置multiple guides顺序
使用 guide_legend() 参数:
p+guides(color = guide_legend(order=1), size = guide_legend(order=2), shape = guide_legend(order=3))
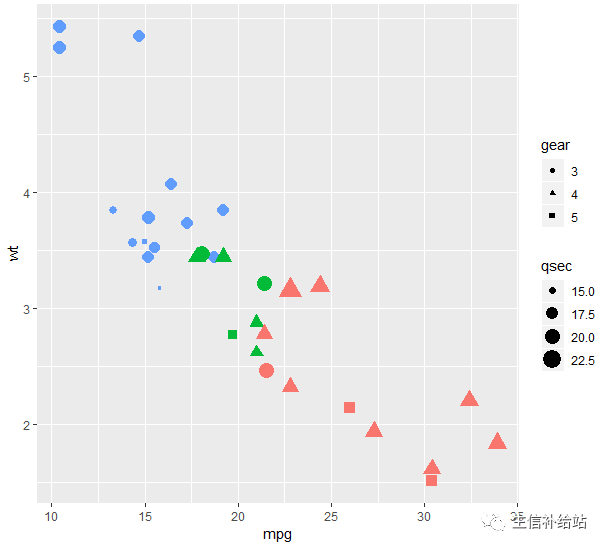
去除particular aesthetic
通过设置FALSE,可不展示对应的legend
p+guides(color = FALSE)
也可以使用scale_xx.函数去掉特定的legend
# Remove legend for the point shape
p+scale_shape(guide=FALSE)
# Remove legend for size
p +scale_size(guide=FALSE)
# Remove legend for color
p + scale_color_manual(values=c('#999999','#E69F00','#56B4E9'),                      guide=FALSE)
通过以上参数的设置即完成对所绘制图形的legend的细节修改,得到自己所需要的图形。
参考资料:http://www.sthda.com/english/wiki/ggplot2-legend-easy-steps-to-change-the-position-and-the-appearance-of-a-graph-legend-in-r-software
