Kaggle实战(四): XGBoost调参
以Kaggle 2015年举办的Otto Group Product Classification Challenge竞赛数据为例,进行XGBoost参数调优探索。
竞赛官网:https://www.kaggle.com/c/otto-group-product-classification-challenge/data
# 导入模块,读取数据
from xgboost import XGBClassifier
import xgboost as xgb

import pandas as pd
import numpy as np

from sklearn.model_selection import GridSearchCV
from sklearn.model_selection import StratifiedKFold

from sklearn.metrics import log_loss

from matplotlib import pyplot
import seaborn as sns
%matplotlib inline

dpath = 'F:/Python_demo/XGBoost/data/'
train = pd.read_csv(dpath +"Otto_train.csv")
train.head()
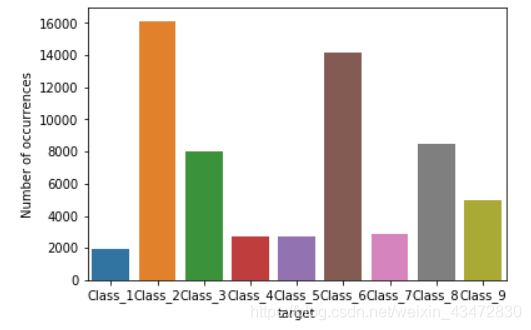
1.看样本分布是否均衡
sns.countplot(train.target);
pyplot.xlabel('target');
pyplot.ylabel('Number of occurrences');
每类样本分布不是很均匀,所以交叉验证时也考虑各类样本按比例抽取
2. 提取训练和标签
y_train = train['target']
y_train = y_train.map(lambda s: s[6:])  # .map 迭代进行函数计算,提取出对应的标签1,2.3.  Class_1中标签1位置为s[6:]
y_train = y_train.map(lambda s: int(s)-1)  # 将标签转化为0开始
train = train.drop(["id", "target"], axis=1)  # 删除id,target行
X_train = np.array(train)  # 输入变量
3.设置交叉验证,各类样本不均衡,交叉验证是采用StratifiedKFold,在每折采样时各类样本按比例采样
kfold = StratifiedKFold(n_splits=5, shuffle=True, random_state=3)4. 设置xgboost默认参数,开始对树个数进行调整,
def modelfit(alg, X_train, y_train, useTrainCV=True, cv_folds=None, early_stopping_rounds=50):

    if useTrainCV:
        xgb_param = alg.get_xgb_params()
        xgb_param['num_class'] = 9  # 设置分类类别数目

        xgtrain = xgb.DMatrix(X_train, label = y_train)  # DMatrix 是 xgb 存储信息的单位,本步骤把数据放进这里面去
        cvresult = xgb.cv(xgb_param, xgtrain, num_boost_round=alg.get_params()['n_estimators'], folds =cv_folds,
             metrics='mlogloss', early_stopping_rounds=early_stopping_rounds, verbose_eval=10)
        # num_boost_round是最大迭代次数,early_stopping_rounds次指标没有提升,输出对应的轮数,verbose_eval次打印一次损失
        n_estimators = cvresult.shape[0]  # 获取最合适树的个数
        alg.set_params(n_estimators = n_estimators)  # 设置最佳值

        print( cvresult )  # 输出交叉验证信息
        #result = pd.DataFrame(cvresult)   #cv缺省返回结果为DataFrame
        #result.to_csv('my_preds.csv', index_label = 'n_estimators')
        cvresult.to_csv('my_preds_4_1.csv', index_label = 'n_estimators')  # 保存交叉验证信息

        # plot
        test_means = cvresult['test-mlogloss-mean']
        test_stds = cvresult['test-mlogloss-std']

        train_means = cvresult['train-mlogloss-mean']
        train_stds = cvresult['train-mlogloss-std']

        x_axis = range(0, n_estimators)
        pyplot.errorbar(x_axis, test_means, yerr=test_stds ,label='Test')
        pyplot.errorbar(x_axis, train_means, yerr=train_stds ,label='Train')
        pyplot.title("XGBoost n_estimators vs Log Loss")
        pyplot.xlabel( 'n_estimators' )
        pyplot.ylabel( 'Log Loss' )
        pyplot.savefig( 'n_estimators.png' )

    #Fit the algorithm on the data
    alg.fit(X_train, y_train, eval_metric='mlogloss')  # 训练最佳算法

    #Predict training set:
    train_predprob = alg.predict_proba(X_train)  # 计算训练集正确度
    logloss = log_loss(y_train, train_predprob)


    #Print model report:
    print ("logloss of train :" )
    print(logloss)


#params = {"objective": "multi:softprob", "eval_metric":"mlogloss", "num_class": 9}

xgb1 = XGBClassifier(
        learning_rate =0.1,
        n_estimators=1000,  #数值大没关系,cv会自动返回合适的n_estimators
        max_depth=5,
        min_child_weight=1,  # 叶子节点需要的最小样本权重
        gamma=0,  # 节点分裂所需的最小损失函数下降值
        silent=0,  # 输出测试信息
        subsample=0.3,  # 样本采样比
        colsample_bytree=0.8,  # 特征比例
        colsample_bylevel=0.7,  # 分裂所需特征比例
        objective= 'multi:softprob',  # 多分类问题
        seed=3)


modelfit(xgb1, X_train, y_train, cv_folds = kfold)
5. 调整树的参数:max_depth & min_child_weight
# 采用上面得到的n_estimators最优值(699),其余参数继续默认值
# 设置超参数调整范围:max_depth 建议3-10, min_child_weight=1/sqrt(稀有事件数) =5.5

max_depth = range(3,10,2)
min_child_weight = range(1,6,2)
param_test2_1 = dict(max_depth=max_depth, min_child_weight=min_child_weight)
{'max_depth': range(3, 10, 2), 'min_child_weight': range(1, 6, 2)}
注意:用交叉验证评价模型性能时,用scoring参数定义评价指标。评价指标是越高越好,因此用一些损失函数当评价指标时,需要再加负号,如neg_log_loss,neg_mean_squared_error 详见sklearn文档:http://scikit-learn.org/stable/modules/model_evaluation.html#log-loss
# 使用机器学习算法进行网格搜索
xgb2_1 = XGBClassifier(
        learning_rate =0.1,
        n_estimators=699,  #第一轮参数调整得到的n_estimators最优值
        max_depth=5,
        min_child_weight=1,
        gamma=0,
        subsample=0.3,
        colsample_bytree=0.8,
        colsample_bylevel = 0.7,
        objective= 'multi:softprob',
        seed=3)


gsearch2_1 = GridSearchCV(xgb2_1, param_grid = param_test2_1, scoring='neg_log_loss',n_jobs=-1, cv=kfold)  # param_grid为所调整的参数
# 网格搜索 (分类器,所调整的参数,评价标准,并行, 交叉验证 )
gsearch2_1.fit(X_train , y_train)
查看评价指标
gsearch2_1.grid_scores_, gsearch2_1.best_params_, gsearch2_1.best_score_, gsearch2_1.cv_results_
# 不同参数情况下的评价结果,最佳结果的参数的组合,最好的评分,交叉验证结果
详细参数,属性设置可见:https://blog.51cto.com/emily18/2088128?utm_source=oschina-app
对验证结果保存并绘制相应图形
# summarize results
print("Best: %f using %s" % (gsearch2_1.best_score_, gsearch2_1.best_params_))
test_means = gsearch2_1.cv_results_[ 'mean_test_score' ]
test_stds = gsearch2_1.cv_results_[ 'std_test_score' ]
train_means = gsearch2_1.cv_results_[ 'mean_train_score' ]
train_stds = gsearch2_1.cv_results_[ 'std_train_score' ]

pd.DataFrame(gsearch2_1.cv_results_).to_csv('my_preds_maxdepth_min_child_weights_1.csv')

# plot results
test_scores = np.array(test_means).reshape(len(max_depth), len(min_child_weight))
train_scores = np.array(train_means).reshape(len(max_depth), len(min_child_weight))

for i, value in enumerate(max_depth):
    pyplot.plot(min_child_weight, -test_scores[i], label= 'test_max_depth:'   + str(value))
#for i, value in enumerate(min_child_weight):
#    pyplot.plot(max_depth, train_scores[i], label= 'train_min_child_weight:'   + str(value))

pyplot.legend()
pyplot.xlabel( 'max_depth' )
pyplot.ylabel( 'Log Loss' )
pyplot.savefig('max_depth_vs_min_child_weght_1.png' )
6.调整完max_depth & min_child_weight后,再次调整一下弱分类区的数目
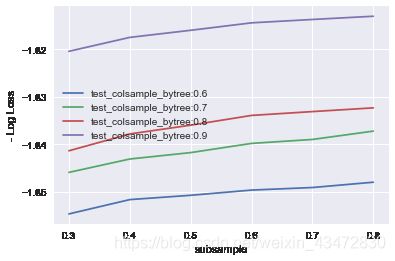
7.调整subsample(每棵树所用样本比例) 和 colsample_bytree(每棵树所用特征比例),与调整max_depth & min_child_weight过程类似
subsample = [i/10.0 for i in range(3,9)]
colsample_bytree = [i/10.0 for i in range(6,10)]
param_test3_1 = dict(subsample=subsample, colsample_bytree=colsample_bytree)
{'colsample_bytree': [0.6, 0.7, 0.8, 0.9],
'subsample': [0.3, 0.4, 0.5, 0.6, 0.7, 0.8]}网格搜索:
xgb3_1 = XGBClassifier(
        learning_rate =0.1,
        n_estimators=645,  #第二轮参数调整得到的n_estimators最优值
        max_depth=6,
        min_child_weight=4,
        gamma=0,
        subsample=0.3,
        colsample_bytree=0.8,
        colsample_bylevel = 0.7,
        objective= 'multi:softprob',
        seed=3)


gsearch3_1 = GridSearchCV(xgb3_1, param_grid = param_test3_1, scoring='neg_log_loss',n_jobs=-1, cv=kfold)
gsearch3_1.fit(X_train , y_train)

gsearch3_1.grid_scores_, gsearch3_1.best_params_,     gsearch3_1.best_score_
画出调整过程中的参数
print("Best: %f using %s" % (gsearch3_1.best_score_, gsearch3_1.best_params_))
test_means = gsearch3_1.cv_results_[ 'mean_test_score' ]
test_stds = gsearch3_1.cv_results_[ 'std_test_score' ]
train_means = gsearch3_1.cv_results_[ 'mean_train_score' ]
train_stds = gsearch3_1.cv_results_[ 'std_train_score' ]

pd.DataFrame(gsearch3_1.cv_results_).to_csv('my_preds_subsampleh_colsample_bytree_1.csv')

# plot results
test_scores = np.array(test_means).reshape(len(colsample_bytree), len(subsample))
train_scores = np.array(train_means).reshape(len(colsample_bytree), len(subsample))

for i, value in enumerate(colsample_bytree):
    pyplot.plot(subsample, -test_scores[i], label= 'test_colsample_bytree:'   + str(value))
#for i, value in enumerate(min_child_weight):
#    pyplot.plot(max_depth, train_scores[i], label= 'train_min_child_weight:'   + str(value))

pyplot.legend()
pyplot.xlabel( 'subsample' )
pyplot.ylabel( 'Log Loss' )
pyplot.savefig( 'subsample_vs_colsample_bytree1.png' )
Best: -1.813067 using {'subsample': 0.8, 'colsample_bytree': 0.9}8.调整正则化参数:reg_alpha(L1/L0正则的惩罚系数)和reg_lambda(L2正则惩罚系数)
reg_alpha = [ 1.5, 2]    #default = 0, 测试0.1,1,1.5,2
reg_lambda = [0.5, 1, 2]      #default = 1,测试0.1, 0.5, 1,2

param_test5_1 = dict(reg_alpha=reg_alpha, reg_lambda=reg_lambda)

xgb5_1 = XGBClassifier(
        learning_rate =0.1,
        n_estimators=645,  #第二轮参数调整得到的n_estimators最优值
        max_depth=6,
        min_child_weight=4,
        gamma=0,
        subsample=0.7,
        colsample_bytree=0.6,
        colsample_bylevel = 0.7,
        objective= 'multi:softprob',
        seed=3)


gsearch5_1 = GridSearchCV(xgb5_1, param_grid = param_test5_1, scoring='neg_log_loss',n_jobs=-1, cv=kfold)
gsearch5_1.fit(X_train , y_train)

# summarize results
print("Best: %f using %s" % (gsearch5_1.best_score_, gsearch5_1.best_params_))
test_means = gsearch5_1.cv_results_[ 'mean_test_score' ]
test_stds = gsearch5_1.cv_results_[ 'std_test_score' ]
train_means = gsearch5_1.cv_results_[ 'mean_train_score' ]
train_stds = gsearch5_1.cv_results_[ 'std_train_score' ]

pd.DataFrame(gsearch5_1.cv_results_).to_csv('my_preds_reg_alpha_reg_lambda_1.csv')

# plot results
test_scores = np.array(test_means).reshape(len(reg_alpha), len(reg_lambda))
train_scores = np.array(train_means).reshape(len(reg_alpha), len(reg_lambda))

#log_reg_alpha = [0,0,0,0]
#for index in range(len(reg_alpha)):
#   log_reg_alpha[index] = math.log10(reg_alpha[index])

for i, value in enumerate(reg_alpha):
    pyplot.plot(reg_lambda, -test_scores[i], label= 'reg_alpha:'   + str(value))
#for i, value in enumerate(min_child_weight):
#    pyplot.plot(max_depth, train_scores[i], label= 'train_min_child_weight:'   + str(value))

pyplot.legend()
pyplot.xlabel( 'reg_alpha' )
pyplot.ylabel( '-Log Loss' )
pyplot.savefig( 'reg_alpha_vs_reg_lambda1.png' )
9.最后再次调整弱分类器的数目


