SIFT算法
文章目录
- 1、基本内容
- 1.1 起源
- 1.2 解决的问题
- 1.3 概念
- 2、实现步骤
- 3、SIFT算法
- 3.1 SIFT特征提取并展示特征点
- 3.1.1 单张照片
- 3.1.2 多张照片
- 3.2 两张图片的SIFT特征匹配
- 3.3 输出匹配最多的三张图片
- 3.4 地理标记图像匹配
- 3.4.1 pydot安装
- 3.4.2 实现
- 3.4.3 小结
- 4、RANSAC
- 4.1 基本内容
- 4.2 步骤
- 4.3 实现
- 4.3.1 ransac_.py
- 4.3.2 主函数
- 4.4 运行结果
- 4.4.1 景深丰富
- 4.4.2 景深单一
- 4.5 小结
- 5、总结
1、基本内容
1.1 起源
David G.Lowe教授在1999年总结了基于特征不变技术的检测方法,在图像尺度空间基础上,提出了对图像缩放、旋转保持不变性的图像局部特征描述算子——SIFT(尺度不变特征变换)。
1.2 解决的问题
- 目标的旋转、缩放、平移(RST)
- 图像仿射 / 投影变换(视点viewpoint)
- 弱光照影响(illumination)
- 部分目标遮挡(occlusion)
- 杂物场景(clutter)
- 噪声
1.3 概念
- 关键点:十分突出的点,不会因光照、尺度、旋转等因素的改变而消失,比如角点、边缘点、暗区域的亮点以及亮区域的暗点。
- 尺度空间(scale space ):其主要思想是通过对原始图像进行尺度变换,获得图像多尺度下的空间表示。从而实现边缘、角点检测和不同分辨率上的特征提取,以满足特征点的尺度不变性。 尺度越大图像越模糊。
- 高斯模糊:用来减小图像噪声以及降低细节层次。
- DoG(Difference of Gaussian)函数 :在计算上只需相邻高斯平滑后图像相减,用于关键点检测。
2、实现步骤
SIFT算法的实质可以归为在不同尺度空间上查找特征点(关键点)的问题。
SIFT算法实现特征匹配主要有三个步骤:
- 提取关键点。
- 特征描述:对关键点附加详细的信息(局部特征),即描述符。
- 建立对应关系:通过特征点(附带上特征向量的关键点)的两两比较找出相互匹配的若干对特征点,建立景物间的对应关系。
3、SIFT算法
3.1 SIFT特征提取并展示特征点
3.1.1 单张照片
代码:
# -*- coding: utf-8 -*-
from PIL import Image
from pylab import *
from PCV.localdescriptors import sift
from PCV.localdescriptors import harris

# 添加中文字体支持
from matplotlib.font_manager import FontProperties
font = FontProperties(fname=r"c:\windows\fonts\SimSun.ttc", size=14)

imname = 'project2_data/5.jpg'
im = array(Image.open(imname).convert('L'))
sift.process_image(imname, '5.sift')
l1, d1 = sift.read_features_from_file('5.sift')

figure()
gray()
subplot(131)
sift.plot_features(im, l1, circle=False)
title(u'SIFT特征',fontproperties=font)
subplot(132)
sift.plot_features(im, l1, circle=True)
title(u'用圆圈表示SIFT特征尺度',fontproperties=font)

# 检测harris角点
harrisim = harris.compute_harris_response(im)

subplot(133)
filtered_coords = harris.get_harris_points(harrisim, 6, 0.1)
imshow(im)
plot([p[1] for p in filtered_coords], [p[0] for p in filtered_coords], '*')
axis('off')
title(u'Harris角点',fontproperties=font)

show()
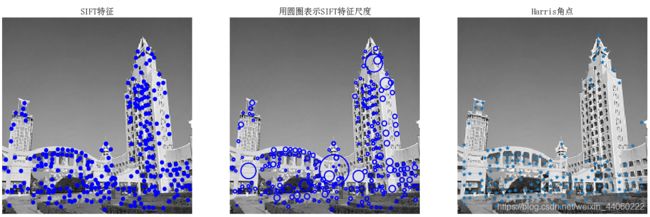
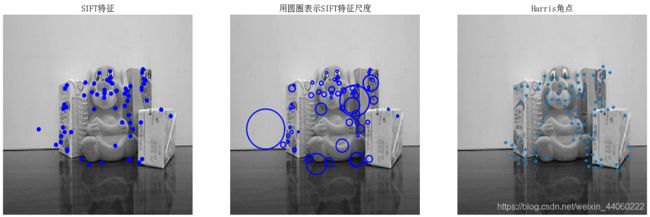
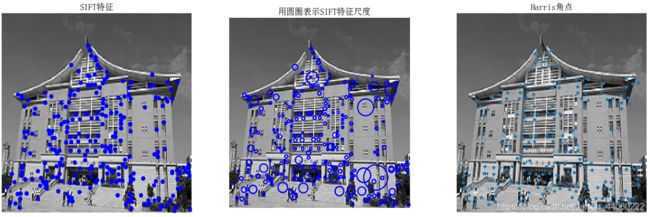
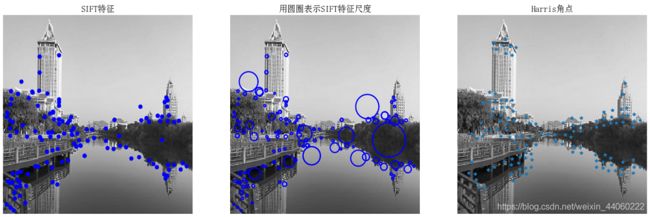
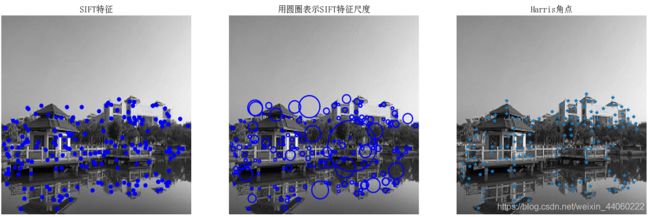
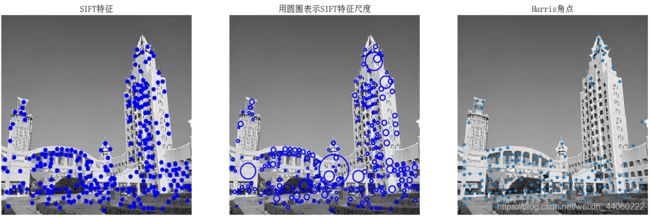
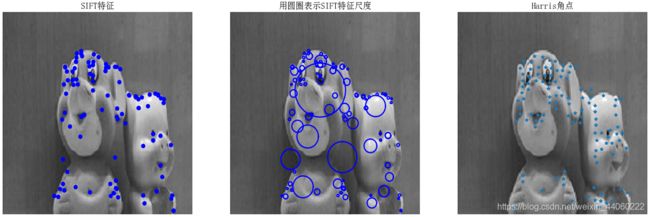
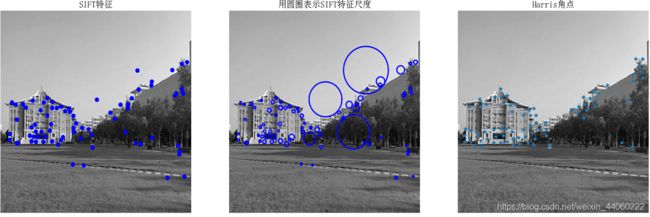
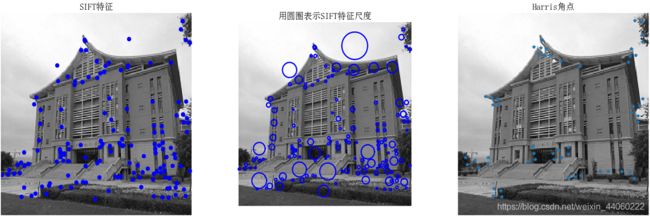
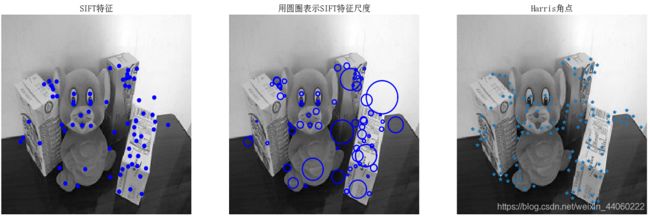
分析:为了将sift和Harris角点进行比较,将Harris角点检测的结果显示在了图像的最后侧。正如图片所示,这两种算法选择了不同的坐标,即选择了不同的关键点。该张照片中,SIFT算法检测出来的特征点多于Harris角点检测出来的角点。
3.1.2 多张照片
代码:
# -*- coding: utf-8 -*-
from PIL import Image
from pylab import *
from PCV.localdescriptors import sift
from PCV.localdescriptors import harris
from PCV.tools.imtools import get_imlist # 导入原书的PCV模块

# 添加中文字体支持
from matplotlib.font_manager import FontProperties
font = FontProperties(fname=r"c:\windows\fonts\SimSun.ttc", size=14)

# 获取project2_data文件夹下的图片文件名(包括后缀名)
filelist = get_imlist('project2_data/')

for infile in filelist: # 对文件夹下的每张图片进行如下操作
    print(infile) # 输出文件名

    im = array(Image.open(infile).convert('L'))
    sift.process_image(infile, 'infile.sift')
    l1, d1 = sift.read_features_from_file('infile.sift')
    i=1

    figure(i)
    i=i+1
    gray()

    subplot(131)
    sift.plot_features(im, l1, circle=False)
    title(u'SIFT特征',fontproperties=font)

    subplot(132)
    sift.plot_features(im, l1, circle=True)
    title(u'用圆圈表示SIFT特征尺度',fontproperties=font)

    # 检测harris角点
    harrisim = harris.compute_harris_response(im)

    subplot(133)
    filtered_coords = harris.get_harris_points(harrisim, 6, 0.1)
    imshow(im)
    plot([p[1] for p in filtered_coords], [p[0] for p in filtered_coords], '*')
    axis('off')
    title(u'Harris角点',fontproperties=font)

    show()
(11)
(15)
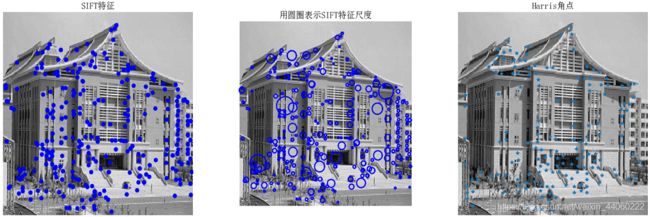
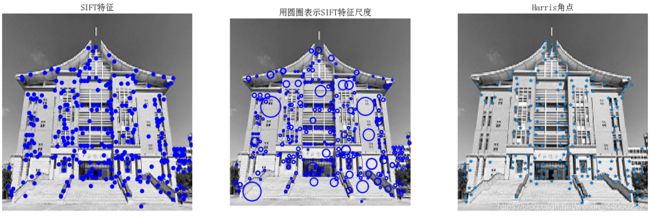
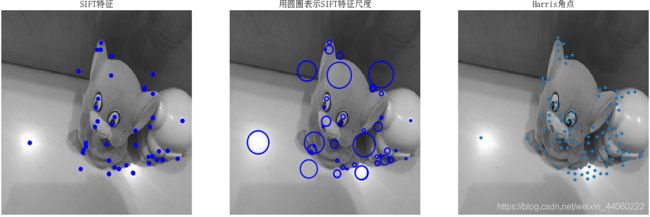
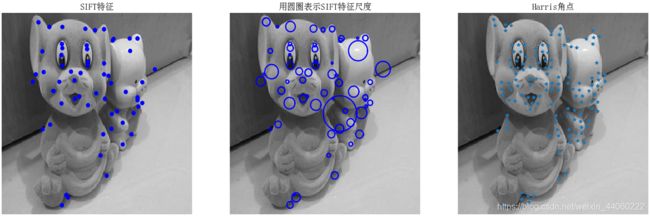
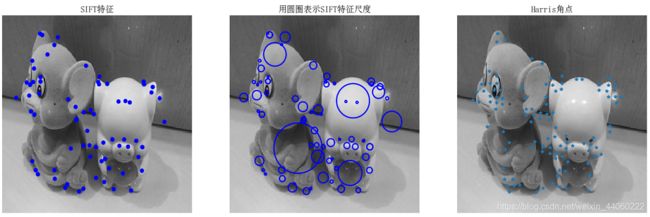
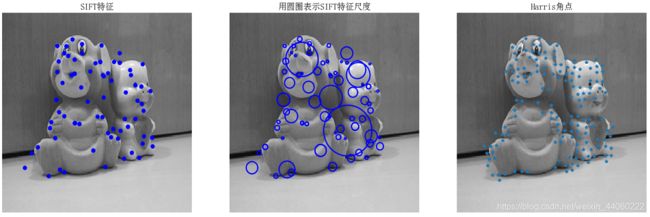
分析:该代码在3.1.1单张照片的基础上添加了一个获取 project2_data 文件夹下的图片文件名,包括后缀名,将所有的图片文件名存在 filelist 中,再将 filelist 内的每张照片依次循环即可。因此运行结果的图片总数=文件夹中每张照片的运行结果(共18)+控制台的运行结果(1)=19张。根据这19张运行结果,我们可分析得出:SIFT具有尺度不变性、方向不变性、光照不变性。 尺度不变性体现在运行结果(2)、(10)、(18)中;方向不变性体现在运行结果(1)、(12)、(14)至(17)或者运行结果(2)、(9)中;光照不变性体现在运行结果(11)、(14)、(16)中。
3.2 两张图片的SIFT特征匹配
代码:
from PIL import Image
from pylab import *
import sys
from PCV.localdescriptors import sift

im1f = 'project2_data/6.jpg'
im2f = 'project2_data/8.jpg'

im1 = array(Image.open(im1f))
im2 = array(Image.open(im2f))

sift.process_image(im1f, 'out_sift_1.txt')
l1, d1 = sift.read_features_from_file('out_sift_1.txt')
figure()
gray()
subplot(121)
sift.plot_features(im1, l1, circle=False)

sift.process_image(im2f, 'out_sift_2.txt')
l2, d2 = sift.read_features_from_file('out_sift_2.txt')
subplot(122)
sift.plot_features(im2, l2, circle=False)

#matches = sift.match(d1, d2)
matches = sift.match_twosided(d1, d2)
print '{} matches'.format(len(matches.nonzero()[0]))

figure()
sift.plot_matches(im1, im2, l1, l2, matches, show_below=True)
gray()
show()
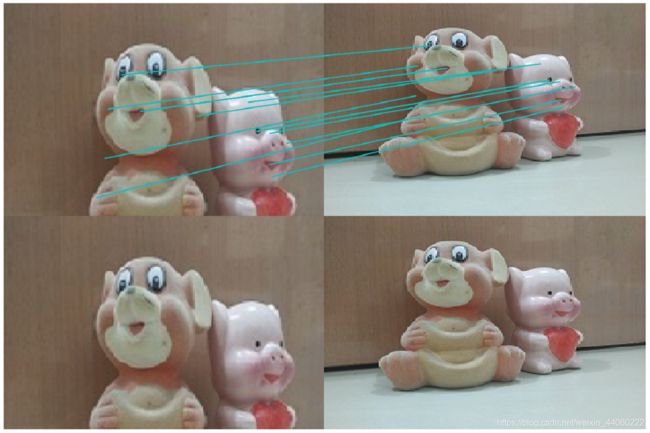
分析:读取两张图片的特征属性值,以矩阵的形式分别返回特征位置l1、l2和描述子d1、d2,并且将带有特征的图像显示出来。然后进行双向匹配,即进行对于第一幅图像中的每个描述子,选取其在第二幅图像中的匹配后,再反过来匹配一次。最后将匹配结果用连线的图片展示出来。
3.3 输出匹配最多的三张图片
代码:
# -*- coding: utf-8 -*-
from PIL import Image
from pylab import *
from numpy import *
import os
from PCV.localdescriptors import sift
from PCV.tools.imtools import get_imlist # 导入原书的PCV模块
import matplotlib.pyplot as plt # plt 用于显示图片
import matplotlib.image as mpimg # mpimg 用于读取图片

# 匹配最多的三张照片

# 获取project2_data文件夹下的图片文件名(包括后缀名)
filelist = get_imlist('project2_data/')

# 输入的图片
im1f = '23.jpg'

im1 = array(Image.open(im1f))
sift.process_image(im1f, 'out_sift_1.txt')
l1, d1 = sift.read_features_from_file('out_sift_1.txt')

i=0
num = [0]*30 # 存放匹配值

for infile in filelist: # 对文件夹下的每张图片进行如下操作

    im2 = array(Image.open(infile))
    sift.process_image(infile, 'out_sift_2.txt')
    l2, d2 = sift.read_features_from_file('out_sift_2.txt')
    matches = sift.match_twosided(d1, d2)
    num[i] = len(matches.nonzero()[0])
    i=i+1
    print '{} matches'.format(num[i-1]) # 输出匹配值

i=1
figure()
gray()
while i<4: # 循环三次,输出匹配最多的三张图片

    index=num.index(max(num))
    print index, filelist[index]
    lena = mpimg.imread(filelist[index])  # 读取当前匹配最大值的图片
    # 此时 lena 就已经是一个 np.array 了,可以对它进行任意处理
    subplot(1,3,i)
    plt.imshow(lena)  # 显示图片
    plt.axis('off')  # 不显示坐标轴
    num[index] = 0  #将当前最大值清零
    i=i+1

show()
运行结果:
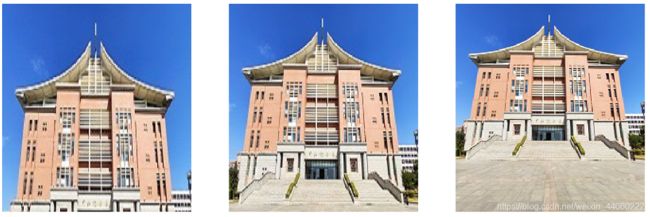
分析:在3.2.3代码可得到匹配值的基础上,将整个文件夹project2_data内的照片遍历一遍,将所有的匹配值存放在列表num中,再利用max()函数以及index()函数分别得到匹配最大值和匹配最大值的下标,之后利用下标,通过matplotlib库即可显示照片。注意,此处要求的是匹配最多的三张照片,因此,我们用了一个while循环,在每次循环结束时将当前循环所得到的匹配最大值清零,这样才不会得到重复的答案。
3.4 地理标记图像匹配
3.4.1 pydot安装
我的电脑环境是pycharm+anaconda2+python2.7,相同环境想配置pydot的可以参考计算机视觉–SIFT特征提取与检索,配置环境在第三点总结里面,感谢这位优秀的朋友分享了成功的经验!
3.4.2 实现
代码:
# -*- coding: utf-8 -*-
from pylab import *
from PIL import Image
from PCV.localdescriptors import sift
from PCV.tools import imtools
import pydot

# graphviz安装路径的bin
import os
os.environ['PATH'] = os.environ['PATH'] + (';D:\\Program Files (x86)\\Graphviz2.38\\bin')

# 图片所在文件夹路径,注意若是复制路径后,则需将\修改为/
download_path = "C:/Users/Desktop/code/project/SIFT_Algorithm/data"
path = "C:/Users/Desktop/code/project/SIFT_Algorithm/data/"

# 获取图像列表和数量
imlist = imtools.get_imlist(download_path)  # 获取download_path文件夹下的图片文件名(包括后缀名)
nbr_images = len(imlist)  # 计算download_path文件夹下图片数量

# 特征提取
featlist = [imname[:-3] + 'sift' for imname in imlist]
for i, imname in enumerate(imlist):
    sift.process_image(imname, featlist[i])  # 处理一幅图像,然后将结果保存在文件中

# 初始化矩阵matchscores
matchscores = zeros((nbr_images, nbr_images))

# 双重循环进行
for i in range(nbr_images):
    for j in range(i, nbr_images):  # 只计算上三角
        print 'comparing ', imlist[i], imlist[j]

        # 读取特征属性值,然后将其以矩阵的形式返回
        l1, d1 = sift.read_features_from_file(featlist[i])
        l2, d2 = sift.read_features_from_file(featlist[j])
        matches = sift.match_twosided(d1, d2)  # 双向匹配
        nbr_matches = sum(matches > 0)  # 计算匹配的特征点
        print 'number of matches = ', nbr_matches
        matchscores[i, j] = nbr_matches  # 记录在矩阵matchscores中
print "The match scores is: \n", matchscores

# 将上三角数据复制到下三角,因为只有一个图片列表nbr_matches,
# 而矩阵matchscores的大小为nbr_matches*nbr_matches,
# 原因:图片1、2匹配的结果与图片2、1匹配的结果是一样的
for i in range(nbr_images):
    for j in range(i + 1, nbr_images):  # no need to copy diagonal
        matchscores[j, i] = matchscores[i, j]

#可视化
threshold = 2  # 最小匹配数为2
g = pydot.Dot(graph_type='graph')  # 不需要默认的有向图

for i in range(nbr_images):
    for j in range(i + 1, nbr_images):

        if matchscores[i, j] > threshold:

            # first image in pair
            im = Image.open(imlist[i])
            im.thumbnail((100, 100))
            filename = path + str(i) + '.jpg'
            im.save(filename)  # 需要大小合适的临时文件
            g.add_node(pydot.Node(str(i), fontcolor='transparent', shape='rectangle', image=filename))

            # second image in pair
            im = Image.open(imlist[j])
            im.thumbnail((100, 100))
            filename = path + str(j) + '.jpg'
            im.save(filename)  # 需要大小合适的临时文件
            g.add_node(pydot.Node(str(j), fontcolor='transparent', shape='rectangle', image=filename))
            g.add_edge(pydot.Edge(str(i), str(j))) # 创建连线

# 保存最后的图片
g.write_png('whitehouse.png')
运行结果:
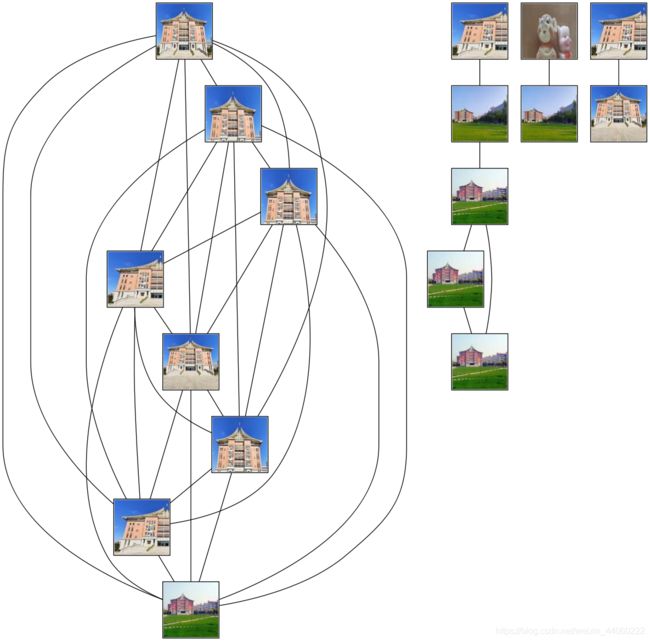
分析:运行结果出来,发现事情不对劲。上图中一共有17张略缩图,而我的文件夹里一共是18张照片,且不止2张玩偶的照片,因此判断略缩图有重复;且上图中玩偶图与建筑物图之间的连线应该是不存在的。考虑到在上面的代码运行中,为了加快运行速度,将文件夹里面的所有照片均调整为 200 * 200 大小。怀疑这个错误与图片分辨率有关,而图片越大运行速度越慢,因此,将图片大小设置为 100 * 100 ,查看运行结果:
同一个数据集、同一个代码,唯一不同的是数据集中图片的分辨率,完全不同的运行结果,这证明了我们的猜测是对的。因此,下面采用分辨率大的照片进行检验,但是由于该数据集的原图没有保存,而分辨率小的图片改成分辨率大的图片,会导致图片失真,必定影响实验结果。解决方法:从网上下载保存了20张其他的图片,构成新的数据集,运行结果如下:
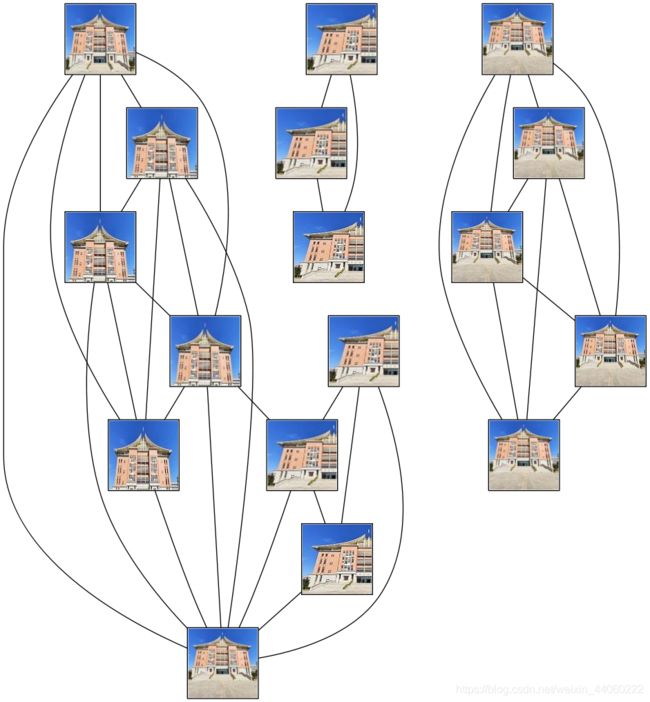
该运行结果较为准确,根据连线关系,将它从左到右分为5部分:第1、3、4、5这四部分十分准确;而第2部分最底层左右两侧的照片明显不正确,若是第2部分最底层左侧照片分到了第1部分,右侧照片分到了第3部分,则结果更为准确。观察到第二部分图片的左右两侧均有树木遮挡,因此可得出当建筑物不同、遮挡物相似时,遮挡物会影响sift特征匹配的结果,从而导致匹配的不正确。
3.4.3 小结
- 利用sift进行匹配时,图片分辨率越低运行速度越快但运行结果正确性较差,图片分辨率越高运行速度越慢而运行结果正确性越高。
- 在sift特征匹配时,遮挡物的纹理很重要,若是遮挡物纹理相近,会导致运行结果的错误匹配。
4、RANSAC
4.1 基本内容
全称:RANdom SAmple Consensus
目的:解决错误匹配的干扰
单应性变换中的单应矩阵H:

其中,一共有8个自由度,而一对匹配点可以构造两个方程:
所以,至少需要4对匹配特征(注意每三个匹配点不能共线)
4.2 步骤
- 随机选择4对匹配特征(注意每三个匹配点不能共线)
- 根据DLT(直接线性变换解法)计算单应矩阵H(唯一解)
- 对所有的匹配点,计算映射残差
- 根据误差阈值(提前定义好的),确定inliers(内点)
- 重复以上步骤,针对最大inliers集合,重新计算单应矩阵H
4.3 实现
4.3.1 ransac_.py
# -*- coding: utf-8 -*-
import numpy as np
import random

def compute_fundamental(x1, x2):
    n = x1.shape[1]
    if x2.shape[1] != n:
        raise ValueError("Number of points don't match.")
    # build matrix for equations建立方程矩阵
    A = np.zeros((n, 9))
    for i in range(n):
        A[i] = [x1[0, i] * x2[0, i], x1[0, i] * x2[1, i], x1[0, i] * x2[2, i],
                x1[1, i] * x2[0, i], x1[1, i] * x2[1, i], x1[1, i] * x2[2, i],
                x1[2, i] * x2[0, i], x1[2, i] * x2[1, i], x1[2, i] * x2[2, i]]
    # compute linear least square solution计算线性最小二乘解
    U, S, V = np.linalg.svd(A)
    F = V[-1].reshape(3, 3)
    # constrain F约束F
    # make rank 2 by zeroing out last singular value
    #通过将最后一个奇异值清零来使等级2
    U, S, V = np.linalg.svd(F)
    S[2] = 0
    F = np.dot(U, np.dot(np.diag(S), V))
    return F / F[2, 2]

def compute_fundamental_normalized(x1, x2):
    """    Computes the fundamental matrix from corresponding points
        (x1,x2 3*n arrays) using the normalized 8 point algorithm.
        从对应点计算基本矩阵
         (x1,x2 3 * n数组)使用归一化8点算法。
         """
    n = x1.shape[1]
    if x2.shape[1] != n:
        raise ValueError("Number of points don't match.")
    # normalize image coordinates归一化图像坐标
    x1 = x1 / x1[2]
    mean_1 = np.mean(x1[:2], axis=1)
    S1 = np.sqrt(2) / np.std(x1[:2])
    T1 = np.array([[S1, 0, -S1 * mean_1[0]], [0, S1, -S1 * mean_1[1]], [0, 0, 1]])
    x1 = np.dot(T1, x1)
    x2 = x2 / x2[2]
    mean_2 = np.mean(x2[:2], axis=1)
    S2 = np.sqrt(2) / np.std(x2[:2])
    T2 = np.array([[S2, 0, -S2 * mean_2[0]], [0, S2, -S2 * mean_2[1]], [0, 0, 1]])
    x2 = np.dot(T2, x2)
    # compute F with the normalized coordinates用归一化坐标计算F
    F = compute_fundamental(x1, x2)
    # print (F)
    # reverse normalization反向归一化
    F = np.dot(T1.T, np.dot(F, T2))
    return F / F[2, 2]

def randSeed(good, num = 8):
    '''
    :param good: 初始的匹配点对
    :param num: 选择随机选取的点对数量
    :return: 8个点对list
    '''
    eight_point = random.sample(good, num)
    return eight_point

def PointCoordinates(eight_points, keypoints1, keypoints2):
    '''
    :param eight_points: 随机八点
    :param keypoints1: 点坐标
    :param keypoints2: 点坐标
    :return:8个点
    '''
    x1 = []
    x2 = []
    tuple_dim = (1.,)
    for i in eight_points:
        tuple_x1 = keypoints1[i[0].queryIdx].pt + tuple_dim
        tuple_x2 = keypoints2[i[0].trainIdx].pt + tuple_dim
        x1.append(tuple_x1)
        x2.append(tuple_x2)
    return np.array(x1, dtype=float), np.array(x2, dtype=float)

def ransac(good, keypoints1, keypoints2, confidence,iter_num):
    Max_num = 0
    good_F = np.zeros([3,3])
    inlier_points = []
    for i in range(iter_num):
        eight_points = randSeed(good)
        x1,x2 = PointCoordinates(eight_points, keypoints1, keypoints2)
        F = compute_fundamental_normalized(x1.T, x2.T)
        num, ransac_good = inlier(F, good, keypoints1, keypoints2, confidence)
        if num > Max_num:
            Max_num = num
            good_F = F
            inlier_points = ransac_good
    print(Max_num, good_F)
    return Max_num, good_F, inlier_points

def computeReprojError(x1, x2, F):
    """
    计算投影误差
    """
    ww = 1.0/(F[2,0]*x1[0]+F[2,1]*x1[1]+F[2,2])
    dx = (F[0,0]*x1[0]+F[0,1]*x1[1]+F[0,2])*ww - x2[0]
    dy = (F[1,0]*x1[0]+F[1,1]*x1[1]+F[1,2])*ww - x2[1]
    return dx*dx + dy*dy

def inlier(F,good, keypoints1,keypoints2,confidence):
    num = 0
    ransac_good = []
    x1, x2 = PointCoordinates(good, keypoints1, keypoints2)
    for i in range(len(x2)):
        line = F.dot(x1[i].T)
        #在对极几何中极线表达式为[A B C],Ax+By+C=0,  方向向量可以表示为[-B,A]
        line_v = np.array([-line[1], line[0]])
        err = h = np.linalg.norm(np.cross(x2[i,:2], line_v)/np.linalg.norm(line_v))
        # err = computeReprojError(x1[i], x2[i], F)
        if abs(err) < confidence:
            ransac_good.append(good[i])
            num += 1
    return num, ransac_good

# 返回两次特征匹配的差集,即返回错误的点
def delete(good, inlier_points):
    goodIndex = []
    for i in good:
        flag = True
        for j in inlier_points:
            if i[0].queryIdx == j[0].queryIdx:
                if i[0].trainIdx == j[0].trainIdx:
                    flag = False
        if flag == True :
            goodIndex.append(i)  # 在good内但不在inlier_points内,即为差集
    return goodIndex
4.3.2 主函数
# -*- coding: utf-8 -*-
import cv2
import ransac_  # 导入自己写的.py文件,这样可调用里面的自定义函数

im1 = 'C://Users//Desktop//code//project//SIFT_Algorithm//data4//1.jpg'
im2 = 'C://Users//Desktop//code//project//SIFT_Algorithm//data4//2.jpg'

# 输出opencv版本
print(cv2.__version__)

psd_img_1 = cv2.imread(im1, cv2.IMREAD_COLOR)
psd_img_2 = cv2.imread(im2, cv2.IMREAD_COLOR)

# SIFT特征计算
sift = cv2.xfeatures2d.SIFT_create()

# 使用SIFT查找关键点和描述符
kp1, des1 = sift.detectAndCompute(psd_img_1, None)
kp2, des2 = sift.detectAndCompute(psd_img_2, None)

# FLANN 参数设计
match = cv2.BFMatcher()
matches = match.knnMatch(des1, des2, k=2)  # 返回k个最佳匹配,即两个最佳匹配

# Apply ratio test
# 比值测试,首先获取与 A距离最近的点 B (最近)和 C (次近),
# 只有当 B/C 小于阀值时(0.75)才被认为是匹配,
# 因为假设匹配是一一对应的,真正的匹配的理想距离为0

# 提取两幅图像特征之后,画出匹配点对连线
good = []
for m, n in matches:
    if m.distance < 0.75 * n.distance:
        good.append([m])

print(good[0][0])
print("number of feature points:",len(kp1), len(kp2))  # 输出特征点数
print(type(kp1[good[0][0].queryIdx].pt))
print("good match num:{} good match points:".format(len(good)))  # 输出最佳匹配数
for i in good: # 输出最佳匹配点
    print(i[0].queryIdx, i[0].trainIdx)

#调用ransac_.py内的自定义函数
Max_num, good_F, inlier_points = ransac_.ransac(good, kp1, kp2, confidence=30, iter_num=500)

# 画出good与inlier_points中点对连线
print("未使用ransac前:{} ".format(len(good)))
print("使用ransac之后:{} ".format(len(inlier_points)))

# 求good与inlier_points的差集,即错误匹配的点
goodIndex = ransac_.delete(good, inlier_points)
print("使用ransac删掉的匹配点的数量:{} ".format(len(goodIndex)))

img3 = cv2.drawMatchesKnn(psd_img_1, kp1, psd_img_2, kp2, good, None, flags=2)
img4 = cv2.drawMatchesKnn(psd_img_1, kp1, psd_img_2, kp2, inlier_points, None, flags=2)
img5 = cv2.drawMatchesKnn(psd_img_1, kp1, psd_img_2, kp2, goodIndex, None, flags=2)

cv2.namedWindow('image1', cv2.WINDOW_NORMAL)
cv2.namedWindow('image2', cv2.WINDOW_NORMAL)
cv2.namedWindow('image3', cv2.WINDOW_NORMAL)
cv2.imshow("image1", img3)
cv2.imshow("image2", img4)
cv2.imshow("image3", img5)

cv2.waitKey(0)#等待按键按下
cv2.destroyAllWindows()#清除所有窗口
4.4 运行结果
4.4.1 景深丰富
控制台:
image2:
image3:
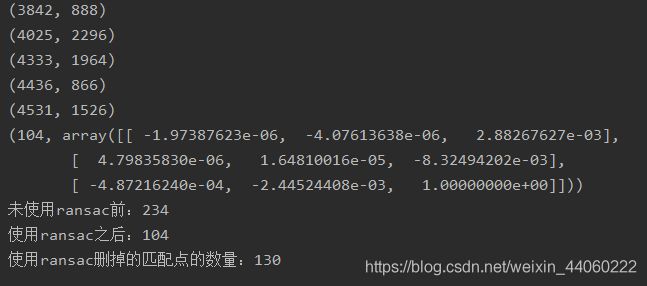
分析: 在控制台上输出了未使用RANSAC之前找到的匹配点为234,使用RANSAC之后找到的匹配点为104,说明RANSAC的使用减少了234-104=130个错误匹配点,与控制台上输出的使用RANSAC删掉的匹配点的数量130个一致。观察image1和image2 的区别,
很明显的三个区别(上图中分别用黑色圈圈和红色序号标出):1——由左上角向右下角倾斜匹配特征;2和3——黑色圈圈所处该区域匹配特征在image2中,与在image1中相比有明显的减少。但是在image1中肉眼难于区分匹配特征的正确与否,因此我们观察image3。
其中,上图3部分黑色画笔圈出区域经过肉眼观察,大概可算出:序号1区域中大概有5个匹配特征错误,序号2区域中有12个匹配特征错误,序号3区域中有5个匹配特征错误。可以发现,一共找出130个错误匹配,其中108个是正确的,22个是错误的,正确率 = 108 / 130 * 100% = 83.08%。
注意:这边的匹配特征的正确与否为肉眼观测,而此图中又过于复杂,因此,正确率存在较大误差,只是一个大概的值。
4.4.2 景深单一
控制台:
image2:
image3:
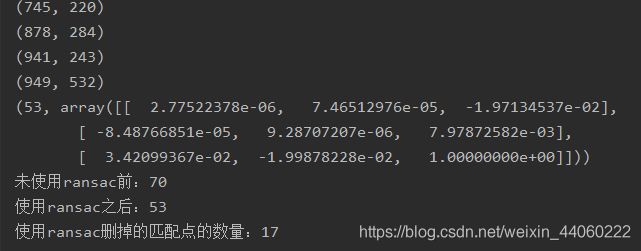
分析: 在控制台上输出了未使用RANSAC之前找到的匹配点为70,使用RANSAC之后找到的匹配点为57,说明RANSAC的使用减少了70-57=13个错误匹配点,与控制台上输出的使用RANSAC删掉的匹配点的数量13个一致。观察image1和image2 的区别,
在image1中标出了上图所示标记,红色画笔圈出来的三对匹配特征与绿色画笔圈出来的一对特征很明显是错误匹配,而RANSAC将其删除了,说明RANSAC还是有一定的可靠性。当然,image3的存在就是为了让我们更加便捷地看出RANSAC运行之后删除的匹配点的正确情况:
通过image3中左右匹配特征的对比,可以发现,一共找出13个错误匹配,其中10个是正确的,3个是错误的(即上图中黑色画笔圈出部分),正确率 = 10 / 13 * 100% = 76.92%。
4.5 小结
- 景深丰富的情况下,使用RANSAC之后删除的错误匹配特征数量大致为原来未使用RANSAC时找出的匹配特征数量的56%,而找到的错误匹配特征的正确率大概为83%。
- 景深单一的情况下,使用RANSAC之后删除的错误匹配特征数量大致为原来未使用RANSAC时找出的匹配特征数量的19%,而找到的错误匹配的特征的正确率大概为77%。
- 直接的感觉为:景深丰富的情况与景深单一的情况相比之下,前者RANSAC剔除的错误匹配特征出错的更多,容易形成其正确率更低的结论,但是,不要忘记了景深丰富情况下RANSAC剔除的错误匹配特征的数量更多,因此,其正确率不一定比后者低。
- RANSAC与最小二乘法的区别:RANSAC可以剔除错误的特征匹配,而最小二乘法只是利用所有数据构建出模型,容易受到错误匹配特征的影响。
注意:若报错:“AttributeError: ‘module’ object has no attribute 'xfeatures2d”,请点击python报错:AttributeError: ‘module’ object has no attribute ‘xfeatures2d’
5、总结
- SIFT特征是图像的局部特征,其对旋转、尺度缩放、亮度变化保持不变性。
- 对视角变化、仿射变换、噪声也保持一定程度的稳定性。
- 信息量丰富,适用于在海量特征数据库中进行快速、准确的匹配。
- 匹配速度快。
- 在图片像素过大时,容易发生不必要的报错;可调整图片的大小,这样程序的运行速度可加快,但会降低匹配值。
