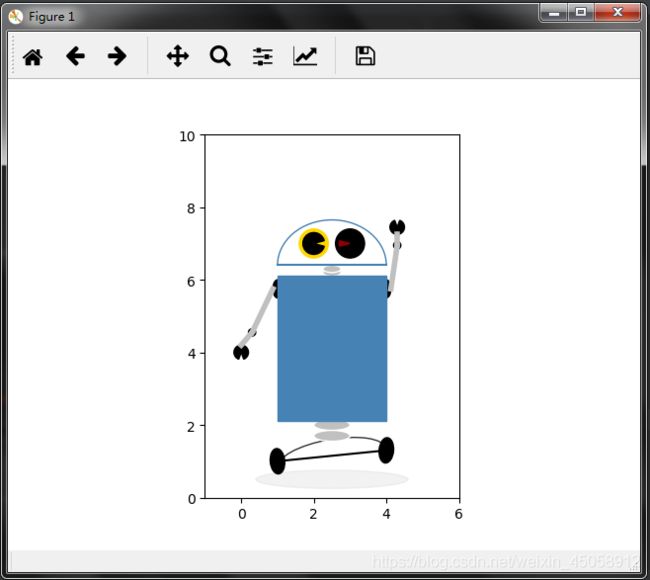
数据可视化实操2-4
圆弧和楔形的绘制方法
- 圆弧的实现方法是借助类Arc实现的
- 楔形是通过类Wedge进行绘制
绘制机器人底部车轮的连接弧线
- Arc((2.5,1.1),3,1,angle=10,theta1=0,theta2=180,color=“k”,alpha=0.8)
- (2.5,1.1):圆弧中心位置的坐标
- 3:圆弧的宽度
- 1:圆弧的高度
- angle:圆弧的逆时针旋转的角度
- theta1:圆弧起点处的角度
- theta2:圆弧终点处的角度
- color:圆弧的颜色
- alpha:圆弧的透明度
绘制机器人左眼的黑色楔形
- Wedge((2,7),0.3,15,345,color=“k”)
- (2,7):楔形的中心位置的坐标
- 0.3:楔形的半径
- 15:楔形起始位置的角度(逆时针方向旋转)
- 345:楔形终止位置的角度(逆时针方向旋转)
- color:楔形的填充区域颜色
我们可以理解圆弧是椭圆没有内部填充颜色时的一部分,楔形是特殊形式的圆形
import matplotlib.pyplot as plt
import numpy as np
from matplotlib.patches import Arc, Ellipse, Rectangle, Wedge

fig, ax = plt.subplots(subplot_kw={"aspect":"equal"})

# shadow
shadow = Ellipse((2.5, 0.5), 4.2, 0.5, color="silver", alpha=0.2)

# base
ax.plot([1, 4], [1, 1.3], color="k")
base = Arc((2.5, 1.1), 3, 1, angle=10, theta1=0, theta2=180, color="k", alpha=0.8)

# wheel
left_wheel = Ellipse((1, 1), 0.7, 0.4, angle=95, color="k")
right_wheel = Ellipse((4, 1.3), 0.7, 0.4, angle=85, color="k")

# joinstyle
bottom_joinstyle1 = Ellipse((2.5, 2), 1, 0.3, facecolor="silver", edgecolor="w")
bottom_joinstyle2 = Ellipse((2.5, 1.7), 1, 0.3, facecolor="silver", edgecolor="w")
left_joinstyle = Ellipse((1, 5.75), 0.5, 0.25, angle=90, color="k")
left_arm_joinstyle1 = Wedge((0.3, 4.55), 0.1, 0, 360, color="k")
left_arm_joinstyle2 = Wedge((0, 4.0), 0.2, 290, 250, color="k")
right_joinstyle = Ellipse((4, 5.75), 0.5, 0.25, angle=90, color="k")
right_arm_joinstyle1 = Wedge((4.3, 6.95), 0.1, 0, 360, color="k")
right_arm_joinstyle2 = Wedge((4.3, 7.45), 0.2, 110, 70, color="k")
top_joinstyle1 = Ellipse((2.5, 6.2), 0.5, 0.2, facecolor="silver", edgecolor="w")
top_joinstyle2 = Ellipse((2.5, 6.3), 0.5, 0.2, facecolor="silver", edgecolor="w")

# body
body = Rectangle((1, 2.1), 3, 4, color="steelblue")

# arms
left_arm1 = ax.plot([0.3, 1-0.125], [4.55, 5.75], color="silver", lw=4)
left_arm2 = ax.plot([0, 0.3], [4.2, 4.55], color="silver", lw=4)
right_arm1 = ax.plot([4+0.125, 4.3], [5.75, 6.95], color="silver", lw=4)
right_arm2 = ax.plot([4.3, 4.3], [6.95, 7.25], color="silver", lw=4)

# head
ax.plot([1, 4], [6.4, 6.4], color="steelblue")
head = Arc((2.5, 6.4), 3, 2.5, angle=0, theta1=0, theta2=180, color="steelblue")

# eyes
left_eye = Wedge((2, 7), 0.4, 0, 360, color="gold")
left_eye_center = Wedge((2, 7), 0.3, 15, 345, color="k")
right_eye = Wedge((3, 7), 0.4, 0, 360, color="k")
right_eye_center = Wedge((3, 7), 0.3, 165, 195, color="darkred")

polygon = [shadow, base, left_wheel, right_wheel, bottom_joinstyle1, bottom_joinstyle2, left_joinstyle,
           left_arm_joinstyle1, left_arm_joinstyle2, right_joinstyle, right_arm_joinstyle1, right_arm_joinstyle2,
           top_joinstyle1, top_joinstyle2, body, head, left_eye, left_eye_center, right_eye, right_eye_center]

for pln in polygon:
    ax.add_patch(pln)

ax.axis([-1, 6, 0, 10])

plt.show()
