使用SAP Analytics Path Framework通过图表和表格方式展示CDS view数据
In Fiori we can easily generate Chart and Table representation with the help of Analytics Path Framework.
It is only necessary for application developer
to prepare data source for the visualization, that is, the CDS view development. The left rendering work is done by APF.
In some of my previous blog I have already introduced the step how you can build a Fiori application with the help of Smart Template + CDS view within a couple of minutes. In this blog the CDS view is again leverage to render some fancy chart.
Step1 create necessary CDS view and automatically generate OData service
To make concept easily understood, I have created a simple ABAP database table:

It has only two entries which will be rendered as column chart by APF later.
Then I have created a cube view by pasting the following source code:
@EndUserText.label: 'Jerry cube view'
@Analytics.dataCategory: #CUBE
@VDM.viewType: #COMPOSITE
@AccessControl.authorizationCheck:#CHECK
@AbapCatalog.sqlViewName: 'zprdcube'
define view Z_C_Prod_Cube as select from zprd_query{
   key zprd_query.prod_id,
  zprd_query.prod_text,
  @DefaultAggregation: #MAX
  zprd_query.quantity
}
And then create a query view ( annotation @Analytics.query: true ) and automatically publish it as OData service ( annotation @OData.publish: true)
@EndUserText.label: 'Jerry query verification'
@VDM.viewType: #CONSUMPTION
@Analytics.query: true
@AccessControl.authorizationCheck:#NOT_ALLOWED
@AbapCatalog.sqlViewName: 'zprdquery'
@OData.publish: true
define view Z_C_Product as select from Z_C_Prod_Cube {
  key Z_C_Prod_Cube.prod_id,
  Z_C_Prod_Cube.prod_text,
  @DefaultAggregation: #MAX
  Z_C_Prod_Cube.quantity
}
Step2 Modelling in APF Modeler
Now go to APF configuration Modeler:

create a new application with Semantic Object with default value “FioriApplication”:


Create a new configuration:

For Smart Filter Bar, specify the OData service published by CDS view we just create:

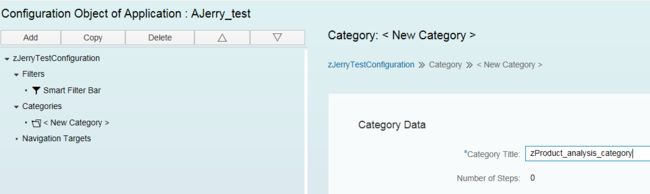
Then create a new category, which will be used by end user as a entry point to use APF:
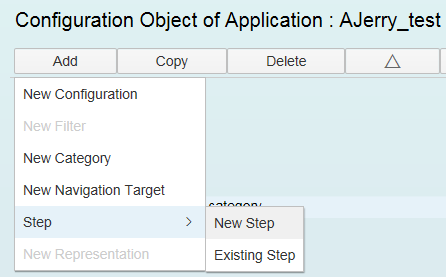
Select the created category and create a new step based on it:
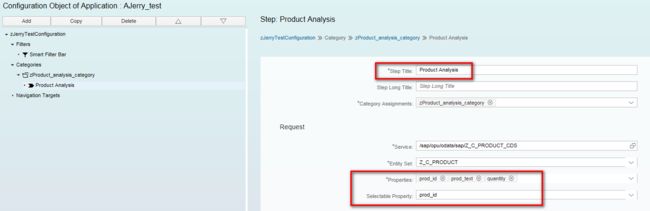
Choose a meaningful name for the step, and specify properties which will be used to render the chart.
The last step is to create a Column chart as representation for the step just created.

And then create a table representation which acts as drill down display, that is, when I click a certain product in column chart, I would like to have its detail information displayed by this table chart. Once saved, click Execute button to load the created application.

Step3 analysis in APF
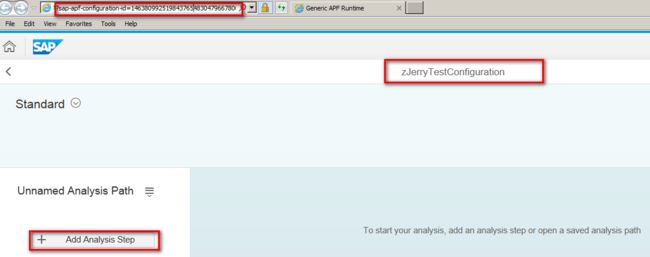
From launched application url we can find that the application is loaded based on the configuration we created in step 2.
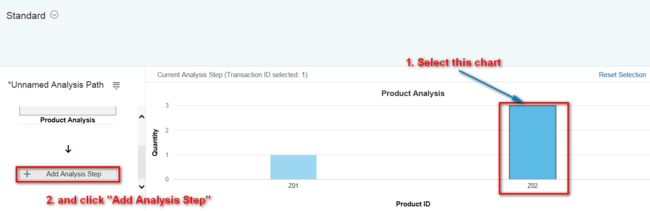
click button “Add Analysis Step”
Choose created category:

and choose step:

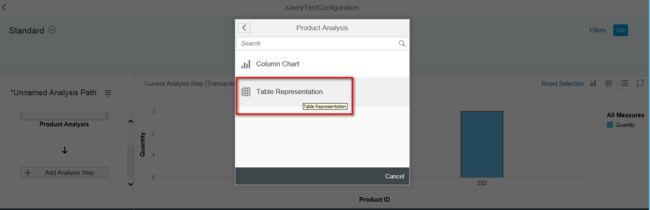
then choose column presentation:

Then column chart is rendered based on the content in query view. Hover mouse on chart and detail information is displayed via tooltip.

Now click the chart part for Z02,
This time choose “Table Representation”:
then the detail information for Z02 is displayed in table style:

Other types of Chart
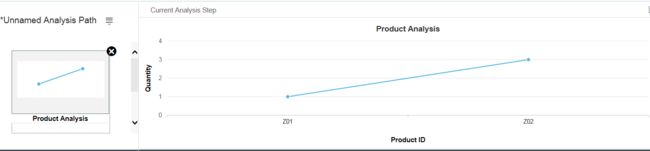
Line Chart:
Bar Chart:

Pie Chart:

要获取更多Jerry的原创文章,请关注公众号"汪子熙":
