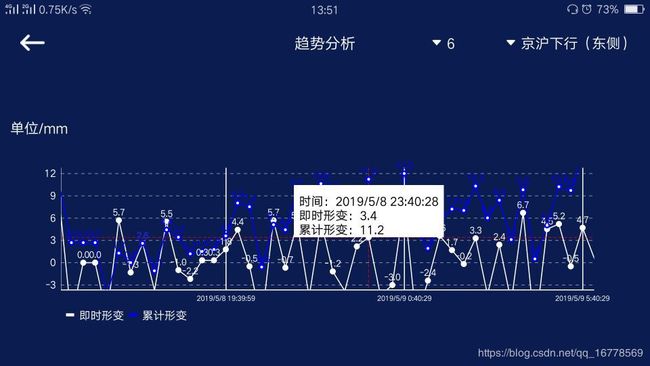
MPAndroidChart 3.0——LineChart多条折线图实现点击焦点,弹出多条折线的对比值
图标属性设置:lineChart相关属性设置
当然在此之前必须实例化lineChart,也就是findviewById
        //设置图表属性
        //设置描述文本不显示
        lineChart.getDescription().setEnabled(false);

        //设置是否可以触摸
        lineChart.setTouchEnabled(true);
        lineChart.setDragDecelerationFrictionCoef(0.9f);
        //设置是否可以拖拽
        lineChart.setDragEnabled(true);
        //设置是否可以缩放
        lineChart.setScaleEnabled(true);
        lineChart.setHighlightPerDragEnabled(true);
        lineChart.setPinchZoom(true);
        lineChart.setDrawGridBackground(false); // 是否显示表格填充颜色
       // lineChart.setGridBackgroundColor(Color.WHITE & 0x70FFFFFF);//设置表格填充颜色
        lineChart.setHighlightPerTapEnabled(true);

        //点击交叉点弹出Y轴对比数据的关键代码调用,调用的是重写MarkerView的MarkerViews类。
        final MarkerViews mv = new MarkerViews(this, R.layout.maekertextview,lineChart,xvalue);
        mv.setChartView(lineChart);
        // set the marker to the chart
        lineChart.setMarker(mv);


        //设置背景颜色
        lineChart.setBackgroundColor(Color.parseColor("#0b1c50"));
        //设置一页最大显示个数为6,超出部分就滑动
        float ratio = (float) values1.size()/(float) 12;
        //显示的时候是按照多大的比率缩放显示,1f表示不放大缩小
        lineChart.zoom(1f,1f,0,0);
        //设置从X轴出来的动画时间
        //mLineChart.animateX(1500);
        //设置XY轴动画
        lineChart.animateXY(1500,1500, Easing.EasingOption.EaseInSine, Easing.EasingOption.EaseInSine);


        /***折线图例 标签 设置***/

        Legend legend = lineChart.getLegend();
        legend.setForm(Legend.LegendForm.LINE);
        legend.setTextSize(11f);
        legend.setTextColor(Color.WHITE);
        //显示位置
        legend.setVerticalAlignment(Legend.LegendVerticalAlignment.BOTTOM);
        legend.setHorizontalAlignment(Legend.LegendHorizontalAlignment.LEFT);
        legend.setOrientation(Legend.LegendOrientation.HORIZONTAL);
        //是否绘制在图表里面
        legend.setDrawInside(false);
        //不显示表边框
        lineChart.setDrawBorders(false);
设置X轴属性的方法setChartXAxis:
    private void setChartXAxis(IAxisValueFormatter xValueFormatter) {
        XAxis xAxis=lineChart.getXAxis();
        //xAxis.setLabelRotationAngle(-10);
        //设置字体大小
        xAxis.setTextSize(7f);
        xAxis.setTextColor(Color.parseColor("#ffffff"));
        //设置从x轴发出的横线
       xAxis.setDrawGridLines(true);
        xAxis.setGridColor(Color.WHITE);
        //设置网格线宽度
         xAxis.setGridLineWidth(1);
        //设置显示X轴
        xAxis.setDrawAxisLine(true);
        //设置X轴显示的位置
        xAxis.setPosition(XAxis.XAxisPosition.BOTTOM);
        **//设置自定义X轴值  注意,这个是自定义的X轴,方法在下面**
        xAxis.setValueFormatter(xValueFormatter);
        //一个界面显示6个Lable,那么这里要设置11个
        xAxis.setLabelCount(12);
        //设置最小间隔,防止当放大时出现重复标签
        xAxis.setGranularity(15f);
        //设置为true当一个页面显示条目过多,X轴值隔一个显示一个
        xAxis.setGranularityEnabled(true);
        //设置X轴的颜色
        xAxis.setAxisLineColor(Color.parseColor("#ffffff"));
        //设置X轴的宽度
        xAxis.setAxisLineWidth(1f);
        xAxis.setTypeface(Typeface.DEFAULT);
       // lineChart.invalidate();
    }
在调用上面setCharXAxis()方法的地方,需要注意这里有个自定义的X轴数据:
//------------------------------xvalue---------
    ArrayList xvalue=new ArrayList<>();//x轴时间
    xvalue.add("2019-9-9");//当然这样可以把X轴的数据随便设置成啥都行。
    xvalue.add("2019-8-9");
    xvalue.add("2019-9-10");......
    xValueFormatter = new xFormatter(xvalue);//实例化自定义x轴
        setChartXAxis(xValueFormatter);//设置x轴

//-----------------关键是不要忘记这里还有个自定义的X轴------
/**
 * Created by Administrator on 2018/4/25 0025.
 * 自定义x轴
 */
public class xFormatter implements IAxisValueFormatter {
    private List mvalue;
    public xFormatter(List values){
        this.mvalue=values;
    }
    private  static  String TAG="xformatter";
    @Override
    public String getFormattedValue(float value, AxisBase axis) {
        return mvalue.get((int)value%mvalue.size());
    }
}
设置Y轴样式:在调用上面设置X轴的地方调用此方法即可
    private void setChartYAxis() {
        //获取右边的轴线
        YAxis rightAxis=lineChart.getAxisRight();
        //设置图表右边的y轴禁用
        rightAxis.setEnabled(false);
        //获取左边的轴线
        YAxis leftAxis = lineChart.getAxisLeft();
        leftAxis.setTextColor(Color.WHITE);
        leftAxis.setAxisLineColor(Color.parseColor("#ffffff"));
        //设置网格线为虚线效果
        leftAxis.enableGridDashedLine(10f, 10f, 0f);
        leftAxis.setDrawGridLines(true);
        leftAxis.setGridColor(Color.WHITE);
        //是否绘制0所在的网格线
        leftAxis.setDrawZeroLine(false);
    }
设置数据源:这里我显示两条折线,需要设置两条数据源
          ArrayList values1 = new ArrayList<>();//数据源1
          ArrayList values2 = new ArrayList<>();//数据源2
         ArrayList Yvaluesone=new ArrayList<>();//即时形变
          ArrayList Yvaluestwo=new ArrayList<>();//累计形变
             LineDataSet set1;
            LineDataSet set2;
 //----------------上面这6个对象直接写在activity最顶部,这里我是为了更方便看懂
        for(int i=0;i<10;i++){//设置假的数据
                    Yvaluesone.add(i);
                     Yvaluestwo.add(i+2);
          }
       for (int i=0;i= Build.VERSION_CODES.JELLY_BEAN_MR2) {
                //设置渐变
                //设置渐变
                set1.setFillColor(Color.parseColor("#0E7AD4"));
            } else {
                set1.setFillColor(Color.parseColor("#0E7AD4"));
            }
          //设置数据2
          set2=new LineDataSet(values2,"累计形变");把Entry格式的list加到第二条折线上
          set2.setColor(Color.BLUE);
          set2.setCircleColor(Color.BLUE);
          set2.setLineWidth(1f);
          set2.setCircleRadius(3f);
          set2.setValueTextSize(9f);
          set2.setValueTextColor(Color.BLUE);

        LineData data = new LineData(set1,set2);
        // 添加到图表中
        lineChart.setData(data);
        //绘制图表
        lineChart.invalidate();
有了以上这些代码就可以正常显示两天折线了。
然后,还记不记得我最开始设置linechart的段代码里有这三行代码:
    //点击交叉点弹出Y轴对比数据的关键代码调用,调用的是重写MarkerView的MarkerViews类。
        final MarkerViews mv = new MarkerViews(this, R.layout.maekertextview,lineChart,xvalue);
        mv.setChartView(lineChart);
        // set the marker to the chart
        lineChart.setMarker(mv);
这三行代码就是弹出两条Y轴值的关键代码:
MarkerViews mv = new MarkerViews();需要传递三个参数,上下文对象、自己建立的xml布局,就是个textview、xvalue(就是我们绘制折线图的时候的X轴的数据)
自己建立的xml代码:名称为maekertextview
MarkerViews 类具体代码:
import android.content.Context;
import android.util.Log;
import android.widget.TextView;

import com.github.mikephil.charting.charts.LineChart;
import com.github.mikephil.charting.components.MarkerView;
import com.github.mikephil.charting.data.Entry;
import com.github.mikephil.charting.data.LineData;
import com.github.mikephil.charting.data.LineDataSet;
import com.github.mikephil.charting.highlight.Highlight;
import com.github.mikephil.charting.utils.MPPointF;
import com.lanzun.tielu.myapplication.R;

import java.util.ArrayList;

public class MarkerViews extends MarkerView {//继承MarkerVIew

    private TextView tvContent;//自己定义的xmL
    LineChart lineChart;//图表控件
    ArrayList xvalue;//X轴数据源
    /**
     * Constructor. Sets up the MarkerView with a custom layout resource.
     *
     * @param context
     * @param layoutResource the layout resource to use for the MarkerView
     */
    public MarkerViews(Context context, int layoutResource, LineChart lineChart,ArrayList xvalue) {
        super(context,layoutResource);
        tvContent = (TextView) findViewById(R.id.tvContent);
        this.lineChart=lineChart;
        this.xvalue=xvalue;
    }

    @Override
    public void refreshContent(Entry e, Highlight highlight) {//重写refreshContent方法(注意,在  //MPAndroidChart早期版本里这里有三个参数,这里有两个,我这是MPAndroidChart 3.0.2版本
    //下面这里是关键的
        LineData lineData=lineChart.getLineData();//得到已经绘制成型的折线图的数据
        LineDataSet set=(LineDataSet)lineData.getDataSetByIndex(0);//获取第一条折线图Y轴数据
        LineDataSet set1=(LineDataSet)lineData.getDataSetByIndex(1);//获取第二条折线图Y轴数据

        int DataSetIndex=highlight.getDataSetIndex();//获取点击的是哪条折线上的交叉点,0就是第一条,以此类推
        int index;
        if (DataSetIndex==0){
            index= set.getEntryIndex(e);//根据点击的该条折线的点,获取当前Y轴数据对应的index值,
        }else {
            index= set1.getEntryIndex(e);//根据点击的该条折线的点,获取当前Y轴数据对应的index值,
        }
        //根据index值,分别获取当前X轴上对应的两条折线的Y轴的值
        Entry entry=set.getEntryForIndex(index);//
        Entry entry1=set1.getEntryForIndex(index);
        Log.i("x,y轴","/"+index+"/"+DataSetIndex);

        tvContent.setText("时间:"+xvalue.get(index)+"\n即时形变:"+entry.getY()+"\n累计形变:"+entry1.getY()); // set the entry-value as the display text

        super.refreshContent(e, highlight);
    }

    @Override
    public MPPointF getOffset() {
        return new MPPointF(-(getWidth() / 2), -getHeight());

    }
}
好了至此,整个功能全部实现,需要注意的是MPAndoridChart低版本:
public void refreshContent(Entry e, int getDataSetIndex,Highlight highlight){//在这个方法里是三个参数
// 那就需要再次获取了,直接使用就可以
有需要可以加我微信,blank901206.
