echarts常用方法,legend颜色自定义,折线label显示问题(五)

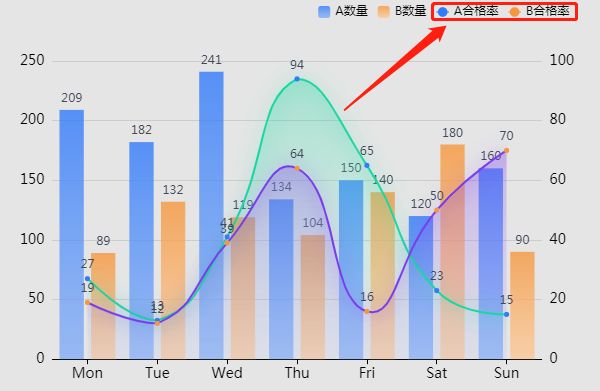
问题描述1:折线图,柱状图结合的双y轴图表的展示,使用通用属性设置echarts的legend时颜色不对,需要手动修改颜色,让颜色和柱图折线图一致。

问题复现:

echarts常用方法,legend颜色自定义,折线label显示问题(五)_第1张图片

通常我们使用是定义颜色会通过如下方式定义:(此方法会出现上图问题)

 let option = {
            color: colorArr,//legend自定义颜色值数组
            legend:{
                right:'4%',
                show:lgendItem && legendShow,
                itemWidth:12,
                itemHeight:12,
                data:lgendItem
            },
    ......
  }

修改为如下代码可解决:

seriesData.push({
                name:item,
                type:"bar",
                data:ydata[item],
                yAxisIndex:0, 
                barWidth: "auto",
                itemStyle: {
                    color: {
                        type: "linear",
                        x: 0,
                        y: 0,
                        x2: 0,
                        y2: 1,
                        colorStops: [{
                            offset: 0, color:itemSty[index%colg][0]  // 0% 处的颜色
                        },{
                            offset: 1, color: itemSty[index%colg][1] // 100% 处的颜色
                        }],
                        globalCoord: false
                    }
                
                },
                color:colorArr[index%colg], //柱图对应的legend的颜色
})
seriesData.push({
                name:item,
                type:"line",
                yAxisIndex:1,  
                data: ydata[item],
                smooth:lineSmooth,
                symbol: 'circle',
                symbolSize: 5,
                showSymbol:symbolShow,
                lineStyle:{
                    color: colorArr[index%colg],
                    shadowColor:colorArr[index%colg],
                    shadowBlur: 20,
                    shadowOffsetX: 1,
                    shadowOffsetY: 0,
                    opacity:1
                
                },
                areaStyle: {
                    color: {
                        type: 'linear',
                        x: 0,
                        y: 0,
                        x2: 0,
                        y2: 1,
                        colorStops: [{
                            offset: 0, color:areaSty[index%colg][0]  // 0% 处的颜色
                        },{
                            offset: 1, color: areaSty[index%colg][1] // 100% 处的颜色
                        }],
                        globalCoord: false 
                    },
                    opacity:areaOpacity,                        
                    
                },
                color:colorArr[index%colg], //折线图对应的legend颜色
              
            })


问题描述2:折线图上方的数据显示问题。如果设置折线上的item隐藏,则label数据值不显示。item设置为显示后,对折线图的label做显示设置才能正常显示出来。
转载于:https://www.cnblogs.com/lmxHome/p/10856640.html

你可能感兴趣的:(echarts常用方法,legend颜色自定义,折线label显示问题(五))