三国TOP10人物分析
import jieba
from wordcloud import WordCloud
#1、 读取小说内容
with open('./novel/threekingdom.txt','r',encoding='utf-8') as f:
    words = f.read()
    counts = {}   #{'曹操':234,'回寨':56}
    excludes = {"将军", "却说", "丞相", "二人", "不可", "荆州", "不能", "如此", "商议",
                "如何", "主公", "军士", "军马", "左右", "次日", "引兵", "大喜", "天下",
                "东吴", "于是", "今日", "不敢", "魏兵", "陛下", "都督", "人马", "不知",
                "孔明曰","玄德曰","刘备","云长"}
    #2、分词
    words_list = jieba.lcut(words)
    #print(words_list)
    for word in words_list:
        if len(word) <= 1:
            continue
        else:
            #更新字典中的值
            #counts[word] = 取出字典中原来键对应的值 +1
            #counts[word] = counts[word] +1  #counts[word]如果没有就要报错
            #字典.get(k)  如果字典中没有这个键 返回NONE
            counts[word] = counts.get(word,0) + 1
    print(len(counts))
    #3、词语过滤,删除无关词,重复词
    counts['孔明'] = counts['孔明'] + counts['孔明曰']
    counts['玄德'] = counts['玄德'] + counts['玄德曰'] + counts['刘备']
    counts['关公'] = counts['关公'] + counts['云长']
    for word in excludes:
        del counts[word]
    #4、排序 [(),()]
    items = list(counts.items())
    print(items)
    # def sort_by_count(x):
    #     return x[1]
    # items.sort(key=sort_by_count,reverse=True)
    items.sort(key=lambda x:x[1],reverse=True)
    li = []  #['孔明',......,'曹操',......]
    count1 = []
    role1 = []
    for i in range(10):
        #序列解包
        role,count = items[i]
        count1.append(count)
        role1.append(role)
        print(role,count)
        #_ 告诉看代码的人,循环里面不需要使用临时变量
        for _ in range(count):
            li.append(role)
    #5、得出结论
    text = ' '.join(li)
    WordCloud(
        font_path='msyh.ttc',
        background_color='skyblue',
        width=800,
        height=600,
        #相邻两个重复词之间的匹配
        collocations=False
    ).generate(text).to_file('./三国TOP10.png')

    from matplotlib import pyplot as plt
    plt.rcParams["font.sans-serif"] = ['SimHei']
    plt.rcParams['axes.unicode_minus'] = False
    plt.pie(count1,shadow=True,labels=role1,autopct='%1.1f%%')
    plt.legend(loc=2)
    plt.axis('equal')
    plt.show()
运行结果:

三国TOP10词云

三国TOP10饼图
匿名函数
①结构:lambda x1,x2...xn:表达式
sum_num = lambda x1,x2 : x1+x2
print(sum_num(2,3))
注:参数可以是无限多个,但是表达式只有一个
②根据工资进行排序
name_info_list = [
    ('张三',4500),
    ('李四',9900),
    ('王五',2000),
    ('赵六',5500),
]
name_info_list.sort(key=lambda x:x[1],reverse=True)
print(name_info_list)
③根据年龄进行排序
stu_info = [
    {'name':'zhangsan','age':18},
    {'name':'lisi','age':30},
    {'name':'wangwu','age':99},
    {'name':'tianqi','age':3},
           ]
stu_info.sort(key=lambda i:i['age'])
print(stu_info)
列表推导式:列表解析和字典解析
之前我们使用普通for 创建列表
li = []
for i in range(10):
   li.append(i)
print(li)
使用列表推导式
[表达式 for 临时变量 in 可迭代对象 可以追加条件]
print([i for i in range(10)])
1、列表解析
①筛选出列表中的偶数
li = []
for i in range(10):
    if i%2 == 0:
        li.append(i)
print(li)
#适用于列表解析
print([i for i in range(10) if i%2 ==0])
②筛选出列表中大于0的数
from random import randint
num_list = [randint(-10,10) for _ in range(10)]
print(num_list)
print([i for i in num_list if i>0])
2、字典解析
筛选大于60分的所有学生
from random import randint
stu_grades = {'student{}'.format(i):randint(50,100) for i in range(1,101)}
print(stu_grades)
print({k:v for k,v in stu_grades.items() if v>60})
matplotlib
①.linspace 左闭右闭区间的等差数列
②x轴:plt.xlabel('时间(s)')
③y轴:plt.ylabel('电压(v)')
④标题:plt.title('欢迎来到python世界')
⑤图例:plt.legend()
⑥显示:plt.show()
⑦距离圆心点的距离:explode
⑦输出大写字母A-F:print(string.ascii_uppercase[0:6])
⑧显示在第二象限:plt.legend(loc=2)
⑨图例与饼图不重合:plt.axis('equal')
⑩透明度:alpha
1、导入
from matplotlib import pyplot as plt
.linspace 左闭右闭区间的等差数列
2、正弦、余弦曲线图
from matplotlib import pyplot as plt
plt.rcParams["font.sans-serif"] = ['SimHei']
plt.rcParams['axes.unicode_minus'] = False
import numpy as np
x = np.linspace(0,2*np.pi,num=100)
print(x)
y = np.sin(x)
cosy = np.cos(x)
plt.plot(x,y,color='g',linestyle='--',label='sin(x)')
plt.plot(x,cosy,color='r',label='cos(x)')
plt.xlabel('时间(s)')
plt.ylabel('电压(v)')
plt.title('欢迎来到python世界')
plt.legend()
plt.show()
运行结果:
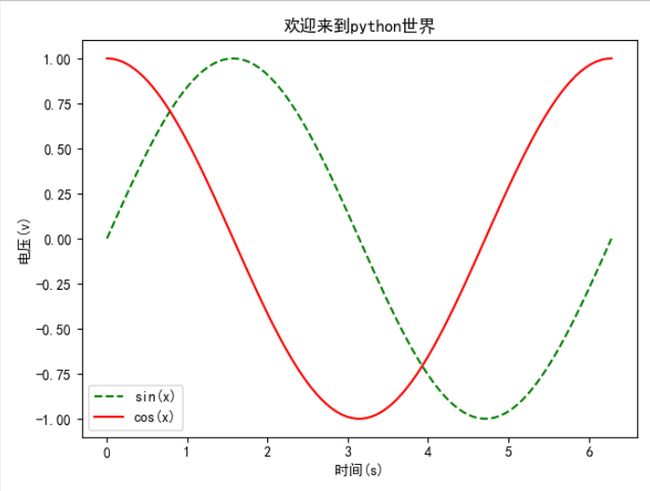
正弦、余弦曲线图
3、柱状图
import string
from random import randint
x = ['口红{}'.format(x) for x in string.ascii_uppercase[:5]]
y = [randint(200,500) for _ in range(5)]
print(x)
print(y)
plt.xlabel('口红品牌')
plt.ylabel('价格(元)')
plt.bar(x,y)
plt.show()
运行结果:
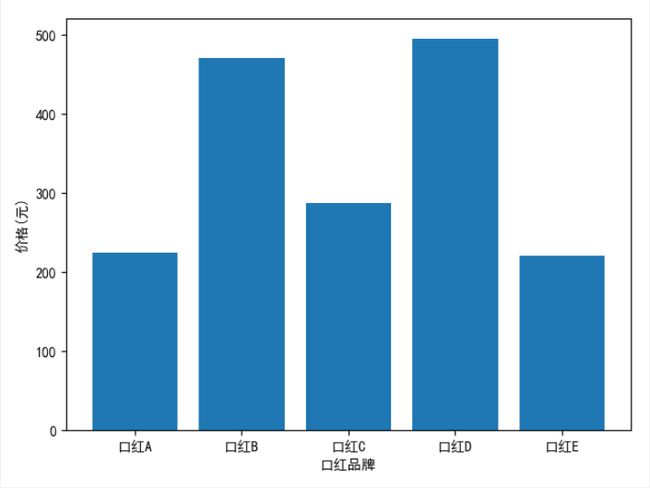
柱状图
4、饼图
from random import randint
import string
counts = [randint(3500,9000) for _ in range(6)]
labels = ['员工{}'.format(x) for x in string.ascii_uppercase[:6]]
explode = [0.1,0,0,0,0,0]
colors = ['red','purple','blue','yellow','gray','green']
plt.pie(counts,explode=explode,shadow=True,labels=labels,autopct='%1.1f%%',colors=colors)
plt.legend(loc=2)
plt.axis('equal')
plt.show()
运行结果:
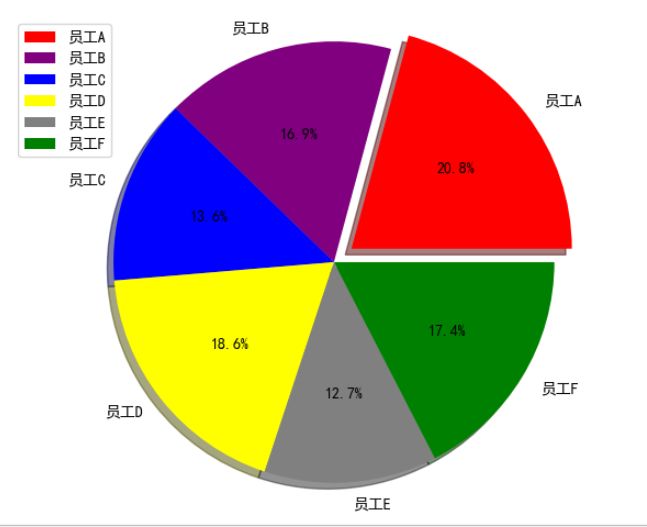
饼图
5、散点图
均值为0 、标准差为1的正太分布数据
x = np.random.normal(0,1,1000)
y = np.random.normal(0,1,1000)
plt.scatter(x,y,alpha=0.1)
plt.show()
运行结果:

散点图
红楼梦TOP10人物分析
import jieba
from wordcloud import WordCloud
#1、 读取小说内容
with open('./novel/all.txt','r',encoding='utf-8') as f:
    words = f.read()
    counts = {}   #{'曹操':234,'回寨':56}
    exclude = {"什么", "一个", "我们", "你们", "如今", "说道", "知道", "起来", "这里",
               "出来", "众人", "那里", "自己", "一面", "只见", "太太", "两个", "没有",
               "怎么", "不是", "不知", "这个", "听见", "这样", "进来", "咱们", "就是",
               "老太太", "东西", "告诉", "回来", "只是", "大家", "姑娘", "奶奶", "凤姐儿",
               "老爷","只得","丫头","这些","他们","不敢","出去","所以"}
    #2、分词
    words_list = jieba.lcut(words)
    #print(words_list)
    for word in words_list:
        if len(word) <= 1:
            continue
        else:
            #更新字典中的值
            #counts[word] = 取出字典中原来键对应的值 +1
            #counts[word] = counts[word] +1  #counts[word]如果没有就要报错
            #字典.get(k)  如果字典中没有这个键 返回NONE
            counts[word] = counts.get(word,0) + 1
    print(len(counts))
    #3、词语过滤,删除无关词,重复词
    counts['贾母'] = counts['贾母'] + counts['老太太'] + counts['奶奶']
    counts['凤姐'] = counts['凤姐'] + counts['凤姐儿'] + counts['王熙凤']
    counts['黛玉'] = counts['黛玉'] + counts['姑娘'] + + counts['林黛玉']
    counts['宝玉'] = counts['宝玉'] + counts['贾宝玉']
    counts['宝钗'] = counts['宝钗'] + counts['薛宝钗']
    counts['老爷'] = counts['老爷'] + counts['贾政']
    counts['王夫人'] = counts['王夫人'] + counts['太太']
    for word in exclude:
        del counts[word]
    #4、排序 [(),()]
    items = list(counts.items())
    print(items)
    # def sort_by_count(x):
    #     return x[1]
    # items.sort(key=sort_by_count,reverse=True)
    items.sort(key=lambda x:x[1],reverse=True)
    li = []  #['孔明',......,'曹操',......]
    count1 = []
    role1 = []
    for i in range(10):
        #序列解包
        role,count = items[i]
        count1.append(count)
        role1.append(role)
        print(role,count)
        #_ 告诉看代码的人,循环里面不需要使用临时变量
        for _ in range(count):
            li.append(role)
    #5、得出结论
    text = ' '.join(li)
    WordCloud(
        font_path='msyh.ttc',
        background_color='pink',
        width=800,
        height=600,
        #相邻两个重复词之间的匹配
        collocations=False
    ).generate(text).to_file('./红楼梦TOP10.png')
    from matplotlib import pyplot as plt

    plt.rcParams["font.sans-serif"] = ['SimHei']
    plt.rcParams['axes.unicode_minus'] = False
    plt.pie(count1, shadow=True, labels=role1, autopct='%1.1f%%')
    plt.legend(loc=2)
    plt.axis('equal')
    plt.show()
运行结果:

红楼梦TOP10词云

红楼梦TOP10饼图