梯度下降 Gradient Descent 从二元到多元
机器学习
首先可以理解机器学习是从一个模型中找到最佳模型,模型是指一系列函数的集合。例如:y=k*x +b,这就是一系列线性函数的集合。
梯度下降(Gradient Descent)
梯度下降就是寻找最佳模型或者函数的方法之一,概念不多说,直接用实例解释更靠谱!(根据斜率的变化分布,调整lr很关键)
待求解问题:
有一组样本,请预测下一个值是多少?(数据y_data是某谣言每日增长量的案例值,单位:万条)
x_data=[0,1,2,3,4,5,6,7,8,9]
y_data=[0.5,5,10,6,3,3.5,7,5,3,4]

实例一:线性模型预测结果
设数据符合线性模型:y=ux + w,只需找到最合适的u与w即可。
这里要提到 Loss(f) 函数,就是计算某个函数的误差多少的函数,利用十个样本点带入y=ux + w,分别得出的十个y值与真实的y_data的差值。为了方便计算取平方
Loss(u,w)=∑ (y_data[n] - ( u*x_data[n]+w))^2
说明:∑是求1-10个样本点的差值平方和;n∈(1-10)
所以只需求得Loss(u,w)函数的最小值时的u与w即可!
import numpy as np
import matplotlib.pyplot as plt
x_data=[x for x in range(10)]
y_data=[0.5,5,10,6,3,3.5,7,5,3,4]

#u与w随便给出初始值
u= 2
w= -1
plt.plot(x_data,y_data)

lr = 0.0001#学习率learn rate
iteration = 100000#迭代次数
loss_history = []#
#开始迭代
for i in range(iteration):
    l_result = 0.0
    for n in range(len(x_data)):
        l_result = l_result + (y_data[n]-(u*x_data[n]+w))**2
    loss_history.append(l_result)#记录误差值
    #开始移动的方向
    u_grade = 0.0
    w_grade = 0.0
    for n in range(len(x_data)):#计算偏微分
        u_grade = u_grade - 2.0*(y_data[n]-u*x_data[n]-w)*x_data[n]
        w_grade = w_grade - 2.0*(y_data[n]-u*x_data[n]-w)

    u = u - lr*u_grade#向最小值移动
    w = w - lr*w_grade#向最小值移动
程序运算结果:u=-0.0242;w=4.809;loss=60.5515
结果如图:橙色为预测结果
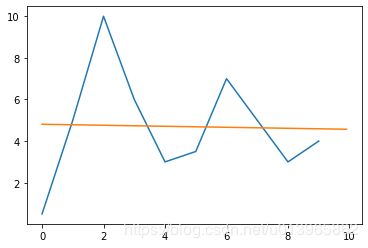
显然预测结果过于粗糙,模型为:y=-0.0242x + 4.809;预测下一个值为:4.567
实例二:三元模型预测结果
假设数据符合模型:y=vx^2 + ux + w
Loss=∑(y_data[n]-(v * x_data[n]^2+u * x_data[n]+w)) ^2
同样需找到Loss最小时v u w 的值:
import numpy as np
import matplotlib.pyplot as plt
x_data=[x for x in range(10)]
y_data=[0.5,5,10,6,3,3.5,7,5,3,4]
plt.plot(x_data,y_data)
#随即给出v u w的初始值
v= 1
u= 1
w= -2
lr = 0.0001
iteration = 100000
loss_history = []
for i in range(iteration):
    l_result = 0.0
    for n in range(len(x_data)):
        l_result = l_result + (y_data[n]-(v*x_data[n]**2+u*x_data[n]+w))**2

    loss_history.append(l_result)
    v_grade = 0.0
    u_grade = 0.0
    w_grade = 0.0
    for n in range(len(x_data)):
        v_grade = v_grade - 2.0*(y_data[n]-v*x_data[n]**2 - u*x_data[n]-w)*(x_data[n]**2)
        u_grade = u_grade - 2.0*(y_data[n]-v*x_data[n]**2 - u*x_data[n]-w)*x_data[n]
        w_grade = w_grade - 2.0*(y_data[n]-v*x_data[n]**2 - u*x_data[n]-w)

    v = v - lr*v_grade*0.001 #为了调整该方向移动速度
    u = u - lr*u_grade
    w = w - lr*w_grade
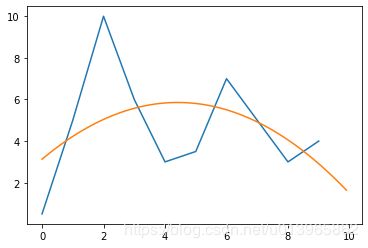
运行结果:v=-0.13996;u=1.235;w=3.1299;Loss=50.18
确实样本误差更小了,但是预测结果并不理想:
y=-0.13996x^2 + 1.235x +3.1299;预测下一个值为:1.48
实例三:四元模型预测结果
假设数据符合模型:y=cx^ 3 + vx^ 2 + u*x + w
Loss= (y_data[n]-(c * x_data[n]^3+v * x_data[n]^2+u * x_data[n]+w))^ 2
同样需找到Loss最小时c v u w 的值:
import numpy as np
import matplotlib.pyplot as plt
x_data=[x for x in range(10)]
y_data=[0.5,5,10,6,3,3.5,7,5,3,4]
plt.plot(x_data,y_data)

c= 0.04
v= -0.65
u= 2.95
w= 2.25

lr = 0.0001
iteration = 100000
loss_history = []

for i in range(iteration):
    l_result = 0.0
    for n in range(len(x_data)):
        l_result = l_result + (y_data[n]-(c*x_data[n]**3+v*x_data[n]**2+u*x_data[n]+w))**2

    loss_history.append(l_result)

    c_grade = 0.0
    v_grade = 0.0
    u_grade = 0.0
    w_grade = 0.0
    for n in range(len(x_data)):
        c_grade = c_grade - 2.0*(y_data[n]-c*x_data[n]**3 - v*x_data[n]**2 - u*x_data[n]-w)*(x_data[n]**3)
        v_grade = v_grade - 2.0*(y_data[n]-c*x_data[n]**3 - v*x_data[n]**2 - u*x_data[n]-w)*(x_data[n]**2)
        u_grade = u_grade - 2.0*(y_data[n]-c*x_data[n]**3 - v*x_data[n]**2 - u*x_data[n]-w)* x_data[n]
        w_grade = w_grade - 2.0*(y_data[n]-c*x_data[n]**3 - v*x_data[n]**2 - u*x_data[n]-w)

    c = c - lr*c_grade*0.00001
    v = v - lr*v_grade*0.001
    u = u - lr*u_grade
    w = w - lr*w_grade
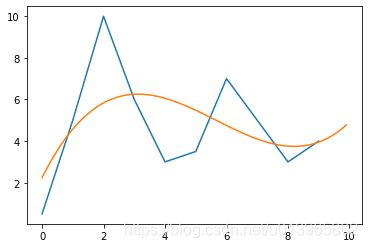
运行结果:c=0.0431;v=-0.71643;u=3.17539;w=2.1069;Loss=39.75
确实样本误差更小了,预测结果比较合理:
y=0.0431x3-0.71643x2 + 3.17539x +2.1069;预测下一个值为:5.3178
如下图所示:
实例四:五元模型预测结果
假设数据符合模型:y=b* x^ 4 + c* x^ 3 + v* x^ 2 + u*x + w
Loss= (y_data[n]-(b * x_data[n]^ 4+c * x_data[n]^3+v * x_data[n]^2+u * x_data[n]+w))^ 2
同样需找到Loss最小时b c v u w 的值:
import numpy as np
import matplotlib.pyplot as plt

x_data=[x for x in range(10)]
y_data=[0.5,5,10,6,3,3.5,7,5,3,4]

plt.plot(x_data,y_data)

#随机给出初始值
b= 0.002531
c= 0.00673
v= -0.591
u=3.198
w= 1.9092

lr = 0.0001
iteration = 100000
loss_history = []


for i in range(iteration):
    l_result = 0.0
    for n in range(len(x_data)):
        l_result = l_result + (y_data[n]-(b*x_data[n]**4+c*x_data[n]**3+v*x_data[n]**2+u*x_data[n]+w))**2

    loss_history.append(l_result)

    b_grade = 0.0
    c_grade = 0.0
    v_grade = 0.0
    u_grade = 0.0
    w_grade = 0.0
    for n in range(len(x_data)):
        b_grade = b_grade - 2.0*(y_data[n]-b*(x_data[n])**4 - c*x_data[n]**3 - v*x_data[n]**2 - u*x_data[n]-w)*(x_data[n]**4)
        c_grade = c_grade - 2.0*(y_data[n]-b*(x_data[n])**4 - c*x_data[n]**3 - v*x_data[n]**2 - u*x_data[n]-w)*(x_data[n]**3)
        v_grade = v_grade - 2.0*(y_data[n]-b*(x_data[n])**4 - c*x_data[n]**3 - v*x_data[n]**2 - u*x_data[n]-w)*(x_data[n]**2)
        u_grade = u_grade - 2.0*(y_data[n]-b*(x_data[n])**4 - c*x_data[n]**3 - v*x_data[n]**2 - u*x_data[n]-w)* x_data[n]
        w_grade = w_grade - 2.0*(y_data[n]-b*(x_data[n])**4 - c*x_data[n]**3 - v*x_data[n]**2 - u*x_data[n]-w)

    b = b - lr*b_grade*0.0001
    c = c - lr*c_grade*0.00001
    v = v - lr*v_grade*0.001
    u = u - lr*u_grade
    w = w - lr*w_grade
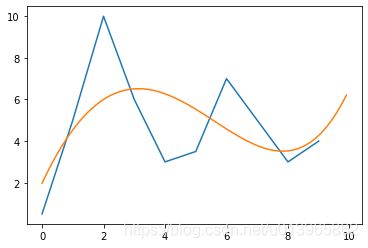
运行结果:b= 0.002108;c=0.011897;v=-0.598699;u=3.1427;w=1.9788;Loss=41.17
样本误差更大了,预测结果较合理:
y= 0.002108x^ 4+0.011897x^ 3-0.598699x^2 + 3.1427x +1.9788;预测下一个值为:6.51
如下图所示:
实例五:六元模型预测结果
假设数据符合模型:y=k* x^ 5+b* x^ 4 + c* x^ 3 + v* x^ 2 + u*x + w
Loss= (y_data[n]-(k * x_data[n]^ 5+b * x_data[n]^ 4+c * x_data[n]^3+v * x_data[n]^2+u * x_data[n]+w))^ 2
同样需找到Loss最小时k b c v u w 的值:
import numpy as np
import matplotlib.pyplot as plt

x_data=[x for x in range(10)]
y_data=[0.5,5,10,6,3,3.5,7,5,3,4]

k= -0.000980
b= 0.014671
c= 0.00034766
v= -0.850866
u= 3.684875
w= 2.02065

lr = 0.0001
iteration = 1000000
loss_history = []
for i in range(iteration):
    l_result = 0.0
    for n in range(len(x_data)):
        l_result = l_result + (y_data[n]-(k*x_data[n]**5+b*x_data[n]**4+c*x_data[n]**3+v*x_data[n]**2+u*x_data[n]+w))**2

    loss_history.append(l_result)


    k_grade = 0.0
    b_grade = 0.0
    c_grade = 0.0
    v_grade = 0.0
    u_grade = 0.0
    w_grade = 0.0
    for n in range(len(x_data)):
        k_grade = k_grade - 2.0*(y_data[n]-k*(x_data[n])**5 - b*(x_data[n])**4 - c*x_data[n]**3 - v*x_data[n]**2 - u*x_data[n]-w)*(x_data[n]**5)
        b_grade = b_grade - 2.0*(y_data[n]-k*(x_data[n])**5 - b*(x_data[n])**4 - c*x_data[n]**3 - v*x_data[n]**2 - u*x_data[n]-w)*(x_data[n]**4)
        c_grade = c_grade - 2.0*(y_data[n]-k*(x_data[n])**5 - b*(x_data[n])**4 - c*x_data[n]**3 - v*x_data[n]**2 - u*x_data[n]-w)*(x_data[n]**3)
        v_grade = v_grade - 2.0*(y_data[n]-k*(x_data[n])**5 - b*(x_data[n])**4 - c*x_data[n]**3 - v*x_data[n]**2 - u*x_data[n]-w)*(x_data[n]**2)
        u_grade = u_grade - 2.0*(y_data[n]-k*(x_data[n])**5 - b*(x_data[n])**4 - c*x_data[n]**3 - v*x_data[n]**2 - u*x_data[n]-w)* x_data[n]
        w_grade = w_grade - 2.0*(y_data[n]-k*(x_data[n])**5 - b*(x_data[n])**4 - c*x_data[n]**3 - v*x_data[n]**2 - u*x_data[n]-w)

    k = k - lr*k_grade*0.0000001
    b = b - lr*b_grade*0.0001
    c = c - lr*c_grade*0.00001
    v = v - lr*v_grade*0.001
    u = u - lr*u_grade
    w = w - lr*w_grade
运行结果:k=-0.002328;b= 0.03316;c=-0.011216;v=-1.49945;u=5.75026;w=1.1103288;Loss=30.21
样本误差最小,预测结果偏差较大:
如下图所示:
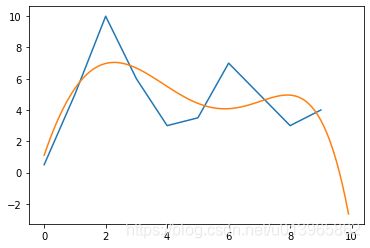
此为过度拟合!
