171031 Matlab数字图像处理-02-灰度变换与空间滤波
2.2.1函数imadjust和stretchlim
subplot间距调整的相关设置
% left是离左面图像边界的距离
% bottom是离下面图像边界的距离
% width是图像x轴长度
% height 是图像y轴长度
% subplot('Position',[0.02 0.65 0.3 0.3]);
% subplot('Position',[0.35 0.65 0.3 0.3]);
% subplot('Position',[0.02 0.3 0.3 0.3]);
% subplot('Position',[0.35 0.3 0.3 0.3]);
% subplot('Position',[left bottom width height]) creates an axes at the position specified by a four-element vector.
% left, bottom, width, and height are in normalized coordinates g=miadjust(f,[lowin,highin],[lowout,highout],gamma)
s=crγ
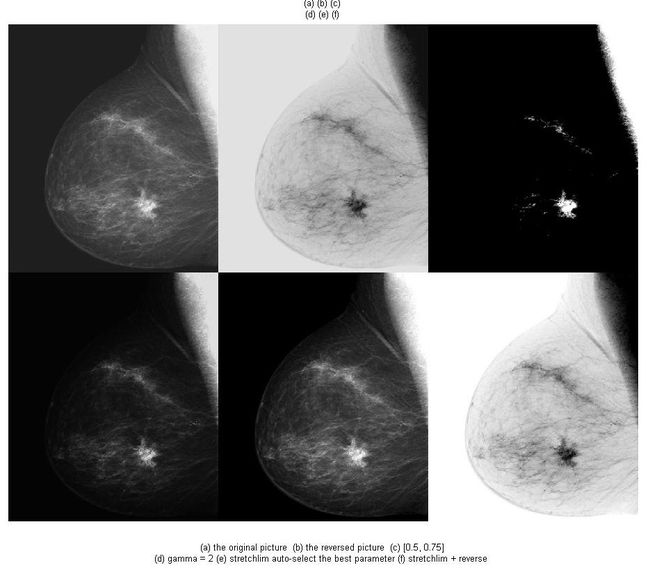
%% 使用函数 imadjust 目的:突出我们感兴趣的亮度带·压缩灰度级的低端并扩展灰度级的高端
clc
clear
in the range from 0.0 to 1.
f = imread('..\Pictures\images_ch03\Fig0303(a)(breast).tif');
g1 = imadjust(f,[0,1],[1,0]); % === imcomplement(f) 灰度反转 @ 灰度负片
g2 = imadjust(f,[0.5,0.75],[0,1]); % 突出我们感兴趣的亮度带
g3 = imadjust(f,[],[],2); % 压缩灰度级的低端并扩展灰度级的高端
%stretchlim: http://blog.sina.com.cn/s/blog_14d1511ee0102wwb6.html
g4 = imadjust(f,stretchlim(f),[])
g5 = imadjust(f,stretchlim(f),[1,0])
G = cat(4,f,g1,g2,g3,g4,g5)
figure
montage(G,'Size',[2 3])
title({'(a) (b) (c)';'(d) (e) (f)'})
xlabel({
    '(a) the original picture  (b) the reversed picture  (c) [0.5, 0.75]';
    '(d) gamma = 2 (e) stretchlim auto-select the best parameter (f) stretchlim + reverse ';})
2.2.2对数及对比度拉伸变换
clc
clear
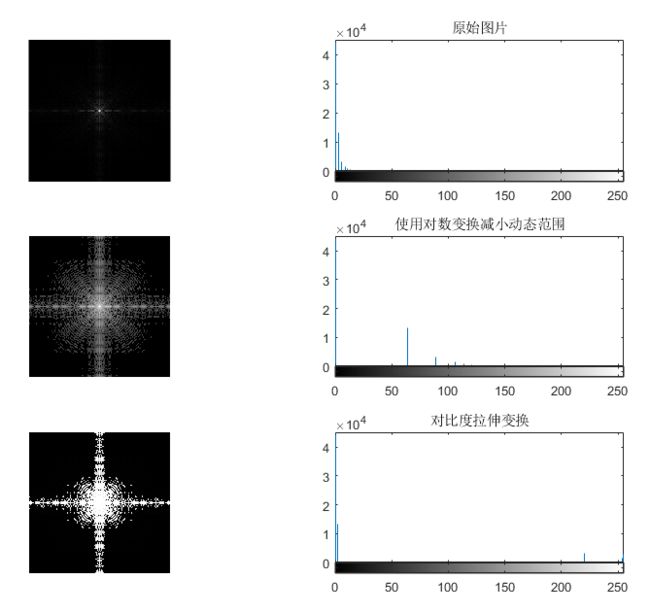
%% 使用对数变换,压缩动态范围
f = imread('..\Pictures\images_ch03\Fig0305(a)(spectrum).tif');
figure
subplot(321),imshow(f)
subplot(322),imhist(f)
title('原始图片')
axis tight
%%
g = im2uint8(mat2gray(log(1 + double(f))));
subplot(323),imshow(g),
subplot(324),imhist(g),
axis tight
title('使用对数变换减小动态范围')
% axis([0 255 0 4000])
%%
m = 5;
E = 10;
h = im2uint8(mat2gray(1./(1 + (m./(double(f) + eps)).^E)));
subplot(325),imshow(h),
subplot(326),imhist(h),
title('对比度拉伸变换')
axis tight
