灰度变换与空间滤波
- 第二章 空间变换与空间滤波
-
- 函数 imadjust 和 stretchlim
- 对数及对比度拉伸变换
- 指定任意灰度变换
- 用于灰度变换的一些实用函数
- 函数intrans
- 函数gscale将图像标度在全尺度
- 直方图处理与函数绘图
- 生成并绘制直方图
- 直方图均衡
- 直方图匹配
- 空间滤波
- 线性空间滤波
- 非线性空间滤波
- 图像处理工具箱的标准空间滤波器
- 线性空间滤波器
- 手工指定滤波器及增强技术的比较
- 非线性空间滤波
- 利用函数medfilt2进行中指滤波
- 线性空间滤波器
-
第二章 空间变换与空间滤波
函数 imadjust 和 stretchlim
imadjust用于对灰度级图像进行灰度变换。
语法格式:g = imadjust(f,[low_in high_in],[low_out high_out],gamma)
f = imread('pig.jpg');
g1 = imadjust(f,[0,1],[1,0]);
imshow(g1)
g = imcomplement(f);
imshow(g)
g2 = imadjust(f,[0.5 0.75],[0 1]);
figure,imshow(g2)
figure,imshow(f)
figure,imshow(g)
figure,imshow(g2)
g3 = imadjust(f,[],[],2);
figure,imshow(g3)


以上分别为原图和变换后的图片
图像的负片同样可以利用函数imcompment得到
g = imcomplment(f);- stretchlim主要用于自适应找到一个分割阈值向量来改变一幅图像的对比度
语法格式:low_high = stretchlim(f,tol);,其中tol是一个标量,默认值我为[0.01 0.99],饱和级别为2%。若选择tol = 0,则Low_High = [min(f(:)) max(f(:))]
注:max(A)和max(A)将返回数组A的最大元素和最小元素。
 > Low_High = stretchlim(f)
 >
 >Low_High =
 >
 > 0.1765 0.1020 0.0863
 > 1.0000 0.9294 0.8667
 >
 > g = imadjust(f,stretchlim(f),[]);
 > figure,imshow(g)
 > g = imadjust(f,stretchlim(f),[1 0]);
 > figure,imshow(g)
>- stretchlim主要用于自适应找到一个分割阈值向量来改变一幅图像的对比度
对数及对比度拉伸变换
表达式:g = c*log(1+f)
gs = im2uint8(mat2gray(g));
imshow(gs)

g = im2uint8(mat2gray(log(1+double(f))))
imshow(g)
使用对数变换可以使图像比较暗部分的细节显示出来,如下图。
指定任意灰度变换
实现灰度映射
函数:interp1,语法形式:g = interp1(z,T,f),其中f是输入图像,g是输出图像,T是一个列向量,z是长度与T相同的列向量,形成方式为z = linspace(0,1,numel(T))
注:linspace函数会生成一行向量。
用于灰度变换的一些实用函数
- nargin : 检测输入到M函数的参数数目 n = nargin
nargout : 检测M函数的输出参数数目 n= nargout
function [x0, y0] = myplot(x, y, npts, angle, subdiv)
% MYPLOT  Plot a function.
% MYPLOT(x, y, npts, angle, subdiv)
%     The first two input arguments are
%     required; the other three have default values.
...
if nargin < 5, subdiv = 20; end
if nargin < 4, angle = 10; end
if nargin < 3, npts = 25; end
...
if nargout == 0
   plot(x, y)
else
   x0 = x;
  y0 = y;
end
varargin : 对应nargin个数的单元数组
- varargout : 对应nargout个数的单元数组
 function varargout=add(a,b,varargin)
 if nargin==2
 varargout{1}=a+b;
 elseif nargin==3
 varargout{1}=a+b;
 varargout{2}=a+b-varargin{1};
 end
函数intrans
实现:function g = intrans(f,method,varargin)
调用:g = intrans(f,’stretch’,mean2(tofloat(f)),0.9)
函数gscale将图像标度在全尺度
实现:function g = gscale(f, varargin)
调用:g = gscale(f,method,low,high)
%GSCALE Scales the intensity of the input image.
%   G = GSCALE(F, 'full8') scales the intensities of F to the full
%   8-bit intensity range [0, 255].  This is the default if there is
%   only one input argument.
%
%   G = GSCALE(F, 'full16') scales the intensities of F to the full
%   16-bit intensity range [0, 65535].
%
%   G = GSCALE(F, 'minmax', LOW, HIGH) scales the intensities of F to
%   the range [LOW, HIGH]. These values must be provided, and they
%   must be in the range [0, 1], independently of the class of the
%   input. GSCALE performs any necessary scaling. If the input is of
%   class double, and its values are not in the range [0, 1], then
%   GSCALE scales it to this range before processing.
%
%   The class of the output is the same as the class of the input.

%   Copyright 2002-2004 R. C. Gonzalez, R. E. Woods, & S. L. Eddins
%   Digital Image Processing Using MATLAB, Prentice-Hall, 2004
%   $Revision: 1.5 $  $Date: 2003/11/21 14:36:09 $

if length(varargin) == 0 % If only one argument it must be f.
   method = 'full8';
else
   method = varargin{1};
end

if strcmp(class(f), 'double') & (max(f(:)) > 1 | min(f(:)) < 0)
   f = mat2gray(f);
end

% Perform the specified scaling.
switch method
case 'full8'
   g = im2uint8(mat2gray(double(f)));
case 'full16'
   g = im2uint16(mat2gray(double(f)));
case 'minmax'
   low = varargin{2}; high = varargin{3};
   if low > 1 | low < 0 | high > 1 | high < 0
      error('Parameters low and high must be in the range [0, 1].')
   end
   if strcmp(class(f), 'double')
      low_in = min(f(:));
      high_in = max(f(:));
   elseif strcmp(class(f), 'uint8')
      low_in = double(min(f(:)))./255;
      high_in = double(max(f(:)))./255;
   elseif strcmp(class(f), 'uint16')
      low_in = double(min(f(:)))./65535;
      high_in = double(max(f(:)))./65535;
   end
   % imadjust automatically matches the class of the input.
   g = imadjust(f, [low_in high_in], [low high]);
otherwise
   error('Unknown method.')
end
直方图处理与函数绘图
生成并绘制直方图
一幅数字图像在[0 G]范围内总共有L个灰度级,其直方图定义为下列离散函数:
h(rk) = nk;
rk:k级灰度,相当于自变量,nk:rk这种灰度级对应的像素数。对于unit8 ,G对应255;对于unit16,G对应65535;对于浮点图像,G对应1.0
归一化直方图:p(rk) = h(rk)/n = nk/n,pk可以看做灰度级rk出现的概率
处理直方图函数:imhist(f,b) f 为输入图像,h 为其直方图,b是用来形成直方图的“容器”的数目(b )
直方图均衡
直方图是图像的最基本的统计特征,它反映的是图像灰度值的分布情况,其反映了图像的明暗分布规律,通过图像变换进行直方图调整,可以获得较好的视觉效果。直方图均衡化是一种点操作,它逐点改变输入图像的灰度值,尽量使各个灰度级别都具有相同的数量的像素点(即输出的直方图是平的),使直方图趋于平衡,这对于图像比较或分割是十分有用的。
归一化直方图:p = imhist(f,b) / numel(f)
 f = imread('Fig3.15(a)1top.jpg');
 g = histeq(f);
 subplot(121),imshow(f);
 subplot(122),imshow(g);
 figure,subplot(121),imhist(f);
 subplot(122),imhist(g);

直方图匹配
将图像直方图以标准图像的直方图为标准作变换,使两图像的直方图相同和近似,从而使两幅图像具有类似的色调和反差。在遥感图像处理中,直方图匹配应用于:①图像镶嵌中图像的灰度调节,通过直方图匹配使相邻两幅图像的色调和反差趋于相同。②多时相图像处理中以一个时相的图像为标准,调节另一幅图像的色调与反差,以便作进一步的运算。③以一幅增强后色调和反差比较满意的图像为标准,对另一幅图像作处理,期望得到类似的结果。
语法:g = histeq(f,hspec),f为输入图像,hspec为规定的直方图,g为输出图像。
直方图均衡与直方图匹配的区别:
生成具有指定直方图的图像的方法称为直方图匹配或直方图规定化。直方图均衡化是将原图像经变换生成一幅灰度级较为均衡化的图像。
空间滤波
线性空间滤波
线性空间滤波与非线性空间滤波
线性空间滤波为对领域像素的计算为线性运算时(如均值滤波、高斯滤波等),否则为非线性空间滤波(如中值滤波、最大最小滤波)
相关和卷积
将模板反转180度的相关就是卷积,相关和图像顺序有关,而卷积无关
相关函数
fspecial函数用于创建预先定义好的滤波器
imfilter函数实现线性空间滤波和特殊的非线性空间滤波
colfilt实现非线性空间滤波,使用前需用padarray来填充,nlfilter也可实现非线性空间滤波,但不常用
ordfilt2也可实现非线性空间滤波【matlab函数描述】
功能:对任意类型数组或多维图像进行滤波。
用法:B = imfilter(A,H)
B = imfilter(A,H,option1,option2,…)
或写作g = imfilter(f, w, filtering_mode, boundary_options, size_options)
其中,f为输入图像,w为滤波掩模,g为滤波后图像。filtering_mode用于指定在滤波过程中是使用“相关”还是“卷积”。boundary_options用于处理边界充零问题,边界的大小由滤波器的大小确定。具体参数选项见下表:

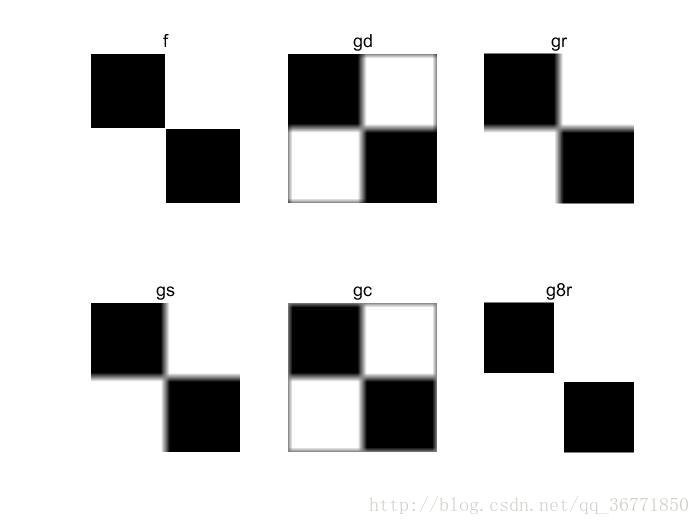
imfilter的应用f(1:250,250:500) = 1; f(250:500,1:250) = 1; subplot(231),imshow(f),title('f'); w = ones(31); subplot(232),gd = imfilter(f,w);imshow(gd,[]),title('gd'); subplot(233),gr = imfilter(f,w,'replicate');imshow(gr,[]),title('gr'); subplot(234),gs = imfilter(f,w,'symmetric');imshow(gs,[]),title('gs'); subplot(235),gc = imfilter(f,w,'circular');imshow(gc,[]),title('gc'); subplot(236),g8r = imfilter(im2uint8(f),w,'replicate');imshow(g8r,[]),title('g8r');
非线性空间滤波
matlab工具箱提供了两个执行常规非线性滤波的函数:nlfilter和colfilt。nlfilter直接执行二维操作,而函数colfilt则以列的形式组织数据,虽然colfilt比nlfilter要占用更多的内存,但执行速度要比nlfilter快许多,因此实际使用中如果注重速度,肯定都是选择的colfilt。
colfilt的原型如下:g=colfilt (f, [m n], ‘sliding’, @fun, parameters).
f:要进行滤波的原图像
[m,n]:掩膜(邻域)的尺寸,一般为奇数*奇数
sliding:块模式,sliding说明逐个像素的滑动mxn区域
@fun:真是实现滤波的函数,它是一个函数指针,我们定义一个函数对mxn区域的像素进行处理,而>这个函数会被colfilt自动调用。
parameters:我们定义的函数要传入的其他参数。在使用colfilt时,滤波前必须显示的填充输入图像。为此,实验二维函数padarray,
fp = padarray(f,[r c],method,direction)
f = [1 2;3 4];fp = padarray(f,[4 5],’replicate’,’post’)
fp =
 1     2     2     2     2     2     2
 3     4     4     4     4     4     4
 3     4     4     4     4     4     4
 3     4     4     4     4     4     4
 3     4     4     4     4     4     4
 3     4     4     4     4     4     4
使用函数colfilt
f = imread('Fig3.20(a).jpg');
   subplot(121),imshow(f)
   g = uint8(colfilt(f,[5 5],'sliding',@mean));
   subplot(122), imshow(g)
图像处理工具箱的标准空间滤波器
线性空间滤波器
工具箱支持许多预定义的二维线性空间滤波器可通过函数fspecial生成的一个滤波模板w,语法为:
w = fspecial(‘type’,parameters)
其中‘type’指定滤波器的类型,parameters进一步定义规定的滤波器。
G=fspecial('gaussian',5)%参数为5,表示产生5*5的gaussian矩阵,如果没有,默认为3*3的矩阵。
G =
    0.0000    0.0000    0.0002    0.0000    0.0000
    0.0000    0.0113    0.0837    0.0113    0.0000
    0.0002    0.0837    0.6187    0.0837    0.0002
    0.0000    0.0113    0.0837    0.0113    0.0000
    0.0000    0.0000    0.0002    0.0000    0.0000
G=fspecial('gaussian',5,1.5)%1.5为滤波器的标准差。
G =
    0.0144    0.0281    0.0351    0.0281    0.0144
    0.0281    0.0547    0.0683    0.0547    0.0281
    0.0351    0.0683    0.0853    0.0683    0.0351
    0.0281    0.0547    0.0683    0.0547    0.0281
    0.0144    0.0281    0.0351    0.0281    0.0144

G=fspecial('average')%默认为3*3的矩阵。均值滤波
G =
    0.1111    0.1111    0.1111
    0.1111    0.1111    0.1111
    0.1111    0.1111    0.1111
> G=fspecial('average',5)%会产生5*5的矩阵。
手工指定滤波器及增强技术的比较
f = imread('Fig3.40(a).jpg');
w4 = fspecial('laplacian',0);
w8 = [1 1 1;1 -8 1;1 1 1];
f = tofloat(f);
g4 = f - imfilter(f,w4,'replicate');
g8 = f - imfilter(f,w8,'replicate');
subplot(131),imshow(f),title(f);
subplot(132),imshow(g4),title(g4);
subplot(133),imshow(g8),title(g8);
非线性空间滤波
函数ordfilt2的语法:g = ordfilt2(f,order,domain)
 f=[1 2 3 ;4 5 6;7 8 9];
g=ordfilt2(f,median(1:9),ones(3,3))
g =
     0     2     0
     2     5     3
     0     5     0
g=ordfilt2(f,1,ones(3,3))
g =
     0     0     0
     0     1     0
     0     0     0
g=ordfilt2(f,9,ones(3,3))
g =
     5     6     6
     8     9     9
     8     9     9
利用函数medfilt2进行中指滤波
fn = imnoise(f,'salt & pepper',0.2);
gm = medfilt2(fn);
gms = medfilt2(fn,'symmetric');


