机器学习——科学数据包(五)时间日期
机器学习——科学数据包(五)时间日期
时间日期
- 时间戳 timestamp:固定的时刻 pd.Timestamp
- 固定时期 period:比如2016年3月份 pd.Period
- 时间间隔 interval : 由起始时间和结束时间来表示
时间日期在Pandas里的作用
- 分析经融数据,如股票交易数据
- 分析服务器日志
datetime
from datetime import datetime
from datetime import timedelta
当前时间 : datetime.now()
时间差 : ①差多少天 delta.days ②差多少秒 delta.total_seconds
将时间转化为指定格式 : .strftime()
date=datetime.datetime(2020, 2, 18, 16, 25)
In [6]:
str(date)
Out[6]:
'2020-02-18 16:25:00'
In [9]:
date.strftime('%y/%m/%d %H:%M:%S')
Out[9]:
'20/02/18 16:25:00'
将时间转化为字符串 : .strptime()
datetime.strptime('2020-1-23 06:55','%Y-%m-%d %H:%M')
Out[10]:
datetime.datetime(2020, 1, 23, 6, 55)
pandas 时间序列
生成series时间序列
dates=[datetime(2016,3,1),datetime(2016,3,2),datetime(2016,3,3),datetime(2016,5,4)]
In [12]:
s=pd.Series(np.random.randn(4),index=dates)
In [13]:
s
Out[13]:
2016-03-01    1.061437
2016-03-02   -0.277053
2016-03-03   -1.983187
2016-05-04    0.280733
dtype: float64
生成日期范围 :起始日期+截止日期
pd.date_range('20200321','20200403')
Out[14]:
DatetimeIndex(['2020-03-21', '2020-03-22', '2020-03-23', '2020-03-24',
               '2020-03-25', '2020-03-26', '2020-03-27', '2020-03-28',
               '2020-03-29', '2020-03-30', '2020-03-31', '2020-04-01',
               '2020-04-02', '2020-04-03'],
              dtype='datetime64[ns]', freq='D')
生成日期 :起始日期+个数 (将小时、秒数正则化)
pd.date_range('20200321  16:22',periods=6,normalize=True)
DatetimeIndex(['2020-03-21', '2020-03-22', '2020-03-23', '2020-03-24',
               '2020-03-25', '2020-03-26'],
              dtype='datetime64[ns]', freq='D')
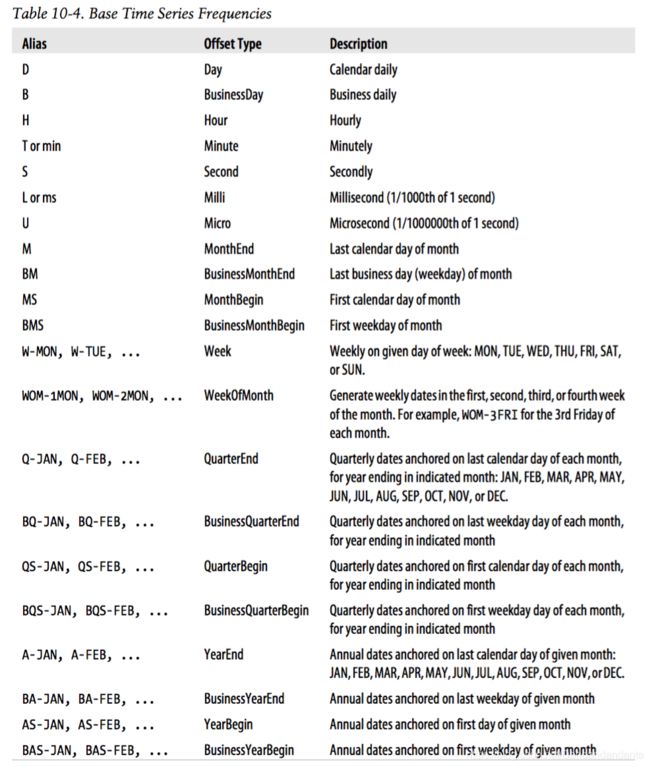
生成不同频率 :修改 freq=
pd.date_range('20200321',periods=6,freq='4H')
Out[16]:
DatetimeIndex(['2020-03-21 00:00:00', '2020-03-21 04:00:00',
               '2020-03-21 08:00:00', '2020-03-21 12:00:00',
               '2020-03-21 16:00:00', '2020-03-21 20:00:00'],
              dtype='datetime64[ns]', freq='4H')
时期序列 : .period_range()
pd.period_range('2020-01','2020-12',freq='M')
PeriodIndex(['2020-01', '2020-02', '2020-03', '2020-04', '2020-05', '2020-06',
             '2020-07', '2020-08', '2020-09', '2020-10', '2020-11', '2020-12'],
            dtype='period[M]', freq='M')
复杂时期转换 : .asfreq
p=pd.Period('2020Q4','Q-JAN')
In [3]:

p.asfreq('M',how='start'),p.asfreq('M',how='end')
Out[3]:
(Period('2019-11', 'M'), Period('2020-01', 'M'))
In [4]:

+16*60+20
#获取该季度倒数第二个工作日下午4时20分
(p.asfreq('B')-1).asfreq('T')+16*60+20
Out[4]:
Period('2020-01-31 16:19', 'T')
时间重采样
- 降采样: 高频率 —低频率(5分钟股票交易)
- 升采样: 低频率 —高频率
- 其他重采样: (每周三*(W.WED)转换为每周五(W.FRI))
Timestamp—Period 相互转换
转化为period: .to_period()
转化为timestamp: .to_timestamp()
时间戳的时间序列转化为时期的时间序列:
s=pd.Series(np.random.randn(5),index=pd.date_range('2016-04-01',periods=5,freq='M'))
In [6]:

s
s
Out[6]:
2016-04-30   -1.132060
2016-05-31    0.034586
2016-06-30   -0.607065
2016-07-31    0.603194
2016-08-31   -1.739736
Freq: M, dtype: float64
In [7]:

s.to_period()
Out[7]:
2016-04   -1.132060
2016-05    0.034586
2016-06   -0.607065
2016-07    0.603194
2016-08   -1.739736
Freq: M, dtype: float64
重采样
采样时间改为5min 每次 : .resample()
#############       采样时间改为5min 每次        ###############
ts=pd.Series(np.random.randint(0,50,60),index=pd.date_range('2020-05-03 06:20',periods=60,freq='T'))
ts.resample('5min',how='sum',label='right')
Out[10]:
2020-05-03 06:25:00    147
2020-05-03 06:30:00    156
2020-05-03 06:35:00     73
2020-05-03 06:40:00    129
2020-05-03 06:45:00    125
2020-05-03 06:50:00    170
2020-05-03 06:55:00    131
2020-05-03 07:00:00     85
2020-05-03 07:05:00    122
2020-05-03 07:10:00    145
2020-05-03 07:15:00     98
2020-05-03 07:20:00    133
Freq: 5T, dtype: int32
OHLC 重采样
金融数据专用:Open/High/Low/Close
In [18]:

ts.resample('5min').ohlc()
Out[18]:
open	high	low	close
2020-05-03 06:20:00	48	48	4	4
2020-05-03 06:25:00	1	49	1	49
2020-05-03 06:30:00	18	45	11	45
2020-05-03 06:35:00	10	47	6	6
2020-05-03 06:40:00	42	42	13	13
2020-05-03 06:45:00	5	47	5	18
2020-05-03 06:50:00	33	42	11	34
2020-05-03 06:55:00	14	38	6	12
2020-05-03 07:00:00	22	46	22	25
2020-05-03 07:05:00	38	43	2	2
2020-05-03 07:10:00	13	46	13	31
2020-05-03 07:15:00	37	46	2	44
降采样
ts.groupby(lambda x:x.month).sum()
ts.groupby(lambda x:x.month).sum()
Out[19]:
5    1535
dtype: int32
In [20]:

ts.groupby(ts.index.to_period('M')).sum()
Out[20]:
2020-05    1535
Freq: M, dtype: int32
升采样 resample().ffill() :向前插值
- resample().ffill() :向前插值
df=pd.DataFrame(np.random.randint(1,50,2),index=pd.date_range('2016-04-22',periods=2,freq='W-FRI'))
df
Out[24]:
2016-04-22	27
2016-04-29	23
In [31]:

df.resample('D').ffill()
Out[31]:
2016-04-22	27
2016-04-23	27
2016-04-24	27
2016-04-25	27
2016-04-26	27
2016-04-27	27
2016-04-28	27
2016-04-29	23
时期重采样
In [32]:
df=pd.DataFrame(np.random.randint(2,30,(24,4)),
               index=pd.period_range('2015-01','2016-12',freq='M'),
               columns=list('ABCD'))
In [33]:df
Out[33]:
A	B	C	D
2015-01	29	8	9	4
2015-02	5	12	9	14
2015-03	17	3	6	27
2015-04	2	9	24	18
2015-05	25	18	7	2
2015-06	20	5	12	11
2015-07	27	26	7	4
2015-08	12	6	23	29
2015-09	10	7	6	14
2015-10	24	5	27	24
2015-11	27	5	21	5
2015-12	26	21	13	12
2016-01	25	27	11	11
2016-02	2	10	19	13
2016-03	2	9	14	11
2016-04	11	19	5	15
2016-05	4	16	15	20
2016-06	22	6	12	24
2016-07	17	21	12	29
2016-08	7	16	11	26
2016-09	29	28	20	22
2016-10	4	5	8	8
2016-11	13	25	23	13
2016-12	4	4	27	13
In [34]:
df.resample('A-DEC',how='sum')
Out[34]:
A	B	C	D
2015	224	125	164	164
2016	140	186	177	205
数据可视化
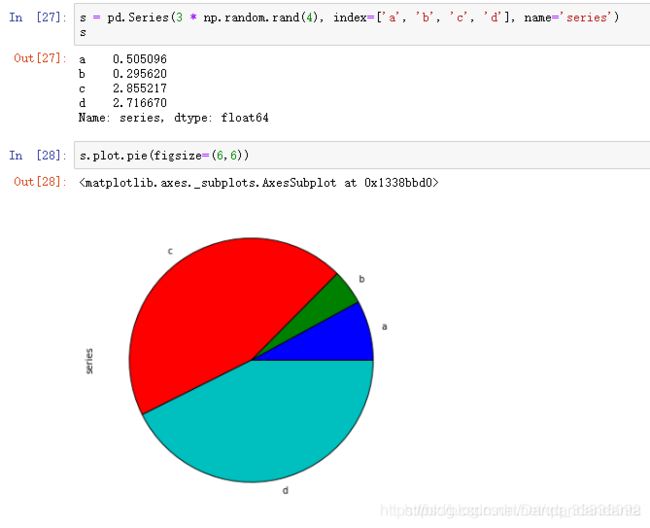
pandas 的数据可视化使用matplotlib为基础组件,主要介绍Pandas里提供的比matlpotlib更便捷的数据可视化操作。
线形图:
%matplotlib inline 可将图画在ipython notebook 里
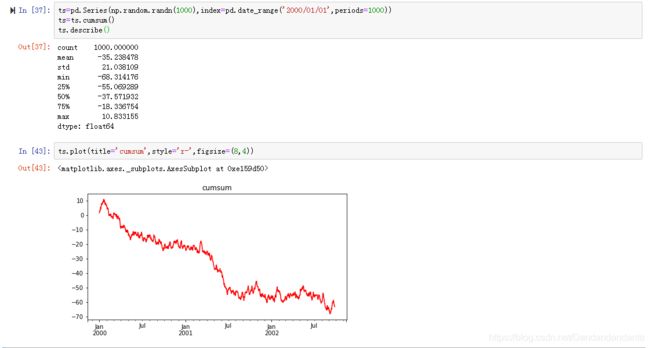
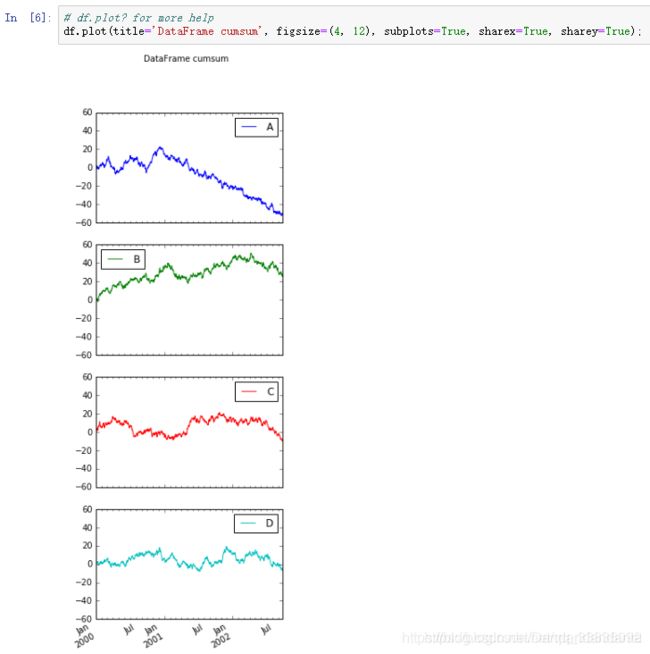
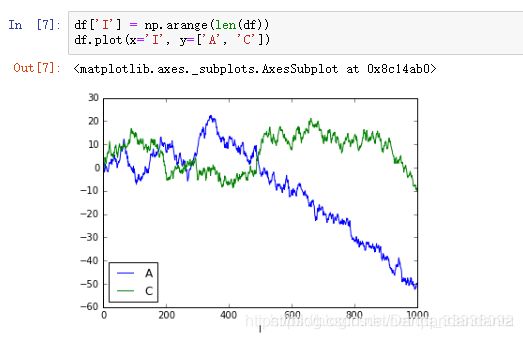
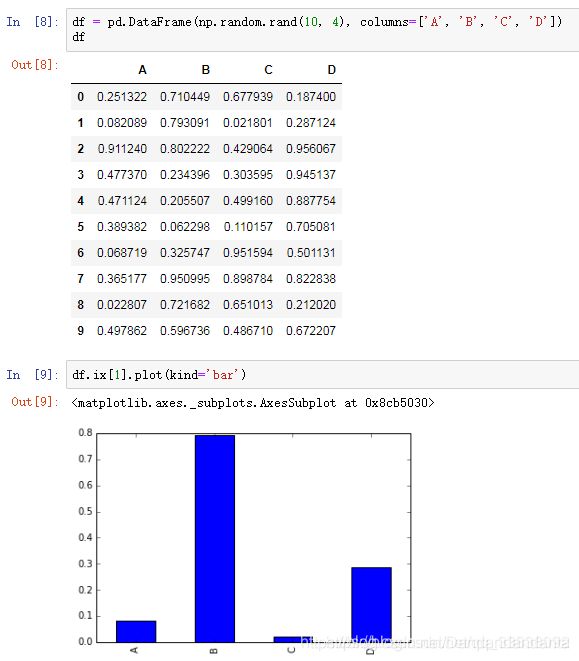
柱状图:
df=pd.DataFrame(np.random.rand(10,4),columns=['A','B','C','D'])
df
Out[51]:
A	B	C	D
0	0.478985	0.243072	0.128097	0.494833
1	0.408160	0.916931	0.505953	0.766929
2	0.381856	0.719301	0.463464	0.838699
3	0.716902	0.273293	0.697121	0.193656
4	0.545572	0.469010	0.347946	0.649463
5	0.369750	0.963513	0.360416	0.958441
6	0.556283	0.655738	0.361159	0.048039
7	0.402009	0.798952	0.247414	0.325514
8	0.341616	0.761453	0.069824	0.913803
9	0.246660	0.148267	0.778272	0.404940
In [52]:

df.ix[1].plot(kind='bar')
Out[52]:
<matplotlib.axes._subplots.AxesSubplot at 0xe449b50>
