① numpy中np.c_和np.r_
np.r_是按列连接两个矩阵,就是把两矩阵上下相加,要求列数相等,类似于pandas中的concat()。
np.c_是按行连接两个矩阵,就是把两矩阵左右相加,要求行数相等,类似于pandas中的merge()。
下面看一个例子:
import numpy as np
a = np.array([1, 2, 3])
b = np.array([4, 5, 6])
c = np.c_[a,b]

print(np.r_[a,b])
print(c)
print(np.c_[c,a])
输出结果:
1 [1 2 3 4 5 6]
2
3 [[1 4]
4  [2 5]
5  [3 6]]
6
7 [[1 4 1]
8  [2 5 2]
9  [3 6 3]]
注意:在numpy中,一个列表虽然是横着表示的,但它是列向量。
②numpy.random.randn() 以及类似函数
numpy.random.rand(d0,d1,…,dn)——and函数根据给定维度生成[0,1)之间的数据,包含0,不包含1,例如:
np.random.rand(4,2)
输出:
array([[ 0.02173903, 0.44376568],
[ 0.25309942, 0.85259262],
[ 0.56465709, 0.95135013],
[ 0.14145746, 0.55389458]])
np.random.rand(4,3,2) # shape: 4*3*2
输出:
array([[[ 0.08256277,  0.11408276],
        [ 0.11182496,  0.51452019],
        [ 0.09731856,  0.18279204]],

       [[ 0.74637005,  0.76065562],
        [ 0.32060311,  0.69410458],
        [ 0.28890543,  0.68532579]],

       [[ 0.72110169,  0.52517524],
        [ 0.32876607,  0.66632414],
        [ 0.45762399,  0.49176764]],

       [[ 0.73886671,  0.81877121],
        [ 0.03984658,  0.99454548],
        [ 0.18205926,  0.99637823]]])
numpy.random.randn(d0,d1,…,dn)——randn函数返回一个或一组样本,具有标准正态分布。
np.random.randn() # 当没有参数时,返回单个数据
输出:
-1.1241580894939212
np.random.randn(2,4)
输出:
array([[ 0.27795239, -2.57882503, 0.3817649 , 1.42367345],
[-1.16724625, -0.22408299, 0.63006614, -0.41714538]])
注:标准正态分布又称为u分布,是以0为均值、以1为标准差的正态分布,记为N(0,1)
转载自:https://blog.csdn.net/u012149181/article/details/78913167
③numpy.linspace
numpy.linspace(start, stop, num=50, endpoint=True, retstep=False, dtype=None)
在指定的间隔内返回均匀间隔的数字。
返回num均匀分布的样本,在[start, stop]。
这个区间的端点可以任意的被排除在外。
参数解释:
start:序列起始点
stop:序列结束点(endpoint为真时包括stop,为假时不包括)
(以下是可选参数)
num:生成的样本数,默认50
endpoint:为真时包括stop,为假时不包括
restep:为真时输出带有步长,为假时输出只有一个ndarry
例如:
In [4]: np.linspace(1, 10, 10, endpoint = False, retstep= True)
Out[4]: (array([ 1. , 1.9, 2.8, 3.7, 4.6, 5.5, 6.4, 7.3, 8.2, 9.1]), 0.9)
dtype:输出的数组的类型
④numpy.zeros
zeros(shape, dtype=float, order='C')
返回来一个给定形状和类型的用0填充的数组;
参数解释:
shape:形状
dtype:数据类型,可选参数,默认numpy.float64
order:可选参数,c代表与c语言类似,行优先;F代表列优先
例如:
np.zeros(5)
array([ 0., 0., 0., 0., 0.])
np.zeros((5,), dtype=np.int)
array([0, 0, 0, 0, 0])
⑥matplotlib.pyplot里contour与contourf
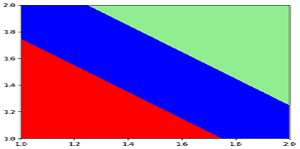
contour和contourf都是画三维等高线图的,不同点在于contourf会对等高线间的区域进行填充,例如:(左:contour;右:contourf)
plt.rcParams['savefig.dpi'] = 300 #图片像素
plt.rcParams['figure.dpi'] = 300 #分辨率
plt.rcParams['figure.figsize'] = (10, 10) # 图像显示大小
plt.rcParams['image.interpolation'] = 'nearest'  # 最近邻差值: 像素为正方形
#Interpolation/resampling即插值,是一种图像处理方法,它可以为数码图像增加或减少象素的数目。
#某些数码相机运用插值的方法创造出象素比传感器实际能产生象素多的图像,或创造数码变焦产生的图像。实际上,几乎所有的图像处理软件支持一种或以上插值方法。图像放大后锯齿现象的强弱直接反映了图像处理器插值运算的成熟程度
plt.rcParams['image.cmap'] = 'gray' # 使用灰度输出而不是彩色输出
plt.axis('off') #打印图片的时候不显示坐标轴
⑧np.random.seed(0)
作用:使得随机数可预测
具体来讲:当我们设置相同的seed,每次生成的随机数相同。如果不设置seed,则每次会生成不同的随机数
例如:
array([ 0.55, 0.72, 0.6 , 0.54])
>>> numpy.random.seed(0) ; numpy.random.rand(4)
array([ 0.55, 0.72, 0.6 , 0.54])
array([ 0.42, 0.65, 0.44, 0.89])
>>> numpy.random.rand(4)
array([ 0.96, 0.38, 0.79, 0.53])
⑨plt.cm.Spectral
例如:
%matplotlib inline
import numpy as np
import matplotlib.pyplot as plt

np.random.seed(1) # 产生相同的随机数

X = np.random.randn(1, 10)
Y = np.random.randn(1, 10)
label = np.array([1,1,0,0,0,0,0,1,1,1])#####两种颜色

plt.scatter(X, Y, c = label, s = 180, cmap = plt.cm.Spectral);
df=pd.DataFrame(columns=['A','B'],data=[[1,2],[3,4]])

#df
#  A B
#0 1 2
#1 3 4

df['C']=None

#df
#  A B  C
#0 1 2 None
#1 3 4 None

