python可视化--Matplotlib库之柱状图
绘制简单柱状图
下面来使用matplotlib绘制一个简单的柱状图,再对其进行定制,以实现信息更丰富的数据可视化。
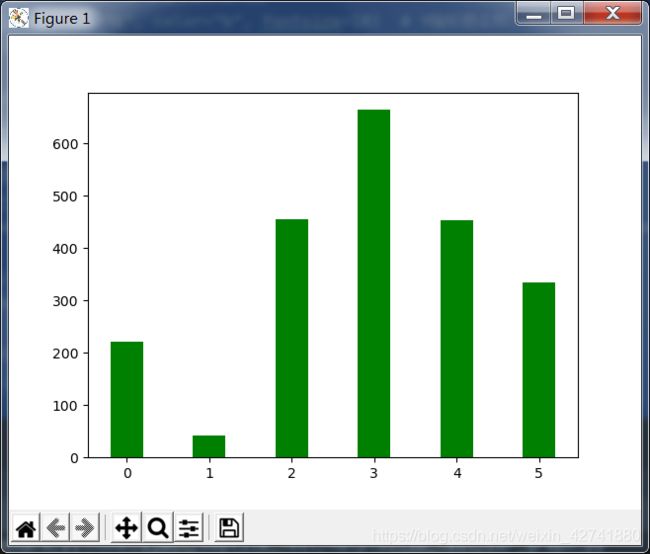
我们将使用[0, 1, 2, 3, 4, 5]作为X值,[222, 42, 455, 664, 454, 334]作为Y值,绘制这个图表。
只需向matplotlib提供如上数字,matplotlib就能完成其他的工作:创建一个脚本bar_graph.py
# 1.导入库
import matplotlib.pyplot as plt

# 2.设置X,Y值
X = [0, 1, 2, 3, 4, 5]
Y = [222, 42, 455, 664, 454, 334]

# 3.画布设置
plt.bar(X, Y, 0.4, color="g")

# 4.显示画布
plt.show()
以上使用matplotlib可制作的最简单的图表,其中查看器还能调整画布的大小和保存图形到本地电脑。
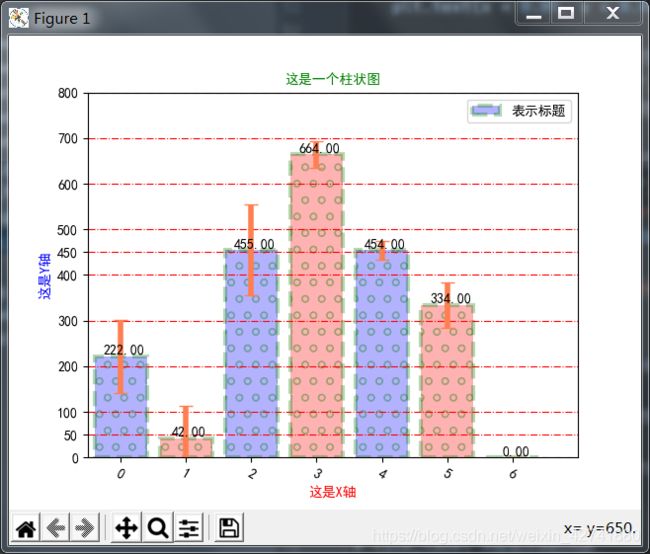
优化一下柱状图,设置柱状图的标题,X轴,Y轴的显示信息等信息
# 1.导入库
import matplotlib.pyplot as plt

# 2.设置X,Y值
X = [0, 1, 2, 3, 4, 5, 6]
Y = [222, 42, 455, 664, 454, 334, 0]
std = [80, 70, 100, 30, 20, 50, 0]  # 设置误差线

# 3.画布设置
plt.rcParams['font.sans-serif'] = ['SimHei']  # 正常显示中文汉字
plt.rcParams['axes.unicode_minus'] = True  # 配置坐标轴刻度值模式,显示负号

for x, y in zip(X, Y):
    plt.text(x + 0.05, y + 0.05, '%.2f' % y, ha='center', va='bottom')  # 数值显示,小数点位数和数显位置

plt.xlim(-.5, 7)  # 设置x轴取值范围
plt.xlabel("这是X轴", color="r", fontsize=10)  # X轴标题名称,大小
plt.xticks(rotation=-30)  # 调整X轴字体角度

plt.ylim(0, 800)  # 设置y轴取值范围
plt.ylabel("这是Y轴", color="b", fontsize=10)  # Y轴标题名称,大小
plt.title("这是一个柱状图", color="g", fontsize=10)  # 大标题名称,大小
plt.yticks([0, 50, 100, 200, 300, 400, 450, 500, 600, 700, 800], rotation=0)  # 设置y刻度

error_params = dict(elinewidth=4, ecolor='coral', capsize=5)  # 设置误差标记参数

# bar柱状图的核心
# width:为柱形图的宽度,一般这是为0.8即可;
# alpha:透明度,值越小越透明
# color或facecolor:柱形图填充的颜色;
# edgecolor:图形边缘颜色
# yerr 是误差线值, error_kw误差参数, tick_label X轴名称
# error_kw 误差值参数
# label 标题
# tick_label X轴显示X的列表
# ls:边的形式
# lw:边的粗细
# hatch:填充的内容
plt.bar(X, Y, width=0.8, alpha=0.3, color=["b", "r"], edgecolor='green', yerr=std, error_kw=error_params, label="表示标题", tick_label=X, ls='--', lw=3, hatch='o')

# 4.显示画布
plt.grid(axis="y", c='r', linestyle='-.')  # 生成网格,可以选择只保留XY轴网格,设置颜色,或者设置虚线
plt.legend(loc='upper right')  # 显示图例位置
plt.show()

# 4.保存图画
# plt.savefig('test.png', dpi=400)  # 保存图像,dpi可以调整图像的像素大小
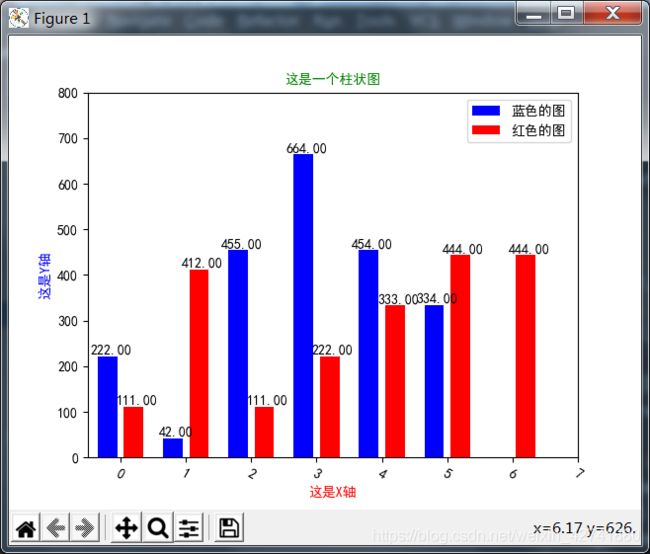
双柱状图
# 1.导入库
import matplotlib.pyplot as plt

# 2.设置X,Y值
X = [-.2, 0.8, 1.8, 2.8, 3.8, 4.8]
X1 = [0.2, 1.2, 2.2, 3.2, 4.2, 5.2, 6.2]
Y = [222, 42, 455, 664, 454, 334]
Y1 = [111, 412, 111, 222, 333, 444, 444]

# 3.画布设置
plt.rcParams['font.sans-serif'] = ['SimHei']  # 正常显示中文汉字

for x, y in zip(X, Y):
    plt.text(x + 0.05, y + 0.05, '%.2f' % y, ha='center', va='bottom')  # 数值显示
for x, y1 in zip(X1, Y1):
    plt.text(x + 0.05, y1 + 0.05, '%.2f' % y1, ha='center', va='bottom')  # 数值显示


plt.xlim(-.5, 7)  # 设置x轴取值范围
plt.xlabel("这是X轴", color="r", fontsize=10)  # X轴标题名称,大小
plt.xticks(rotation=-30)  # 调整X轴字体角度

plt.ylim(0, 800)  # 设置y轴取值范围
plt.ylabel("这是Y轴", color="b", fontsize=10)  # Y轴标题名称,大小
plt.title("这是一个柱状图", color="g", fontsize=10)  # 大标题名称,大小


# 柱状图的核心,数字显示的是柱状图的间距和宽度范围在(0-1)之间,color="b"是表示颜色
plt.bar(X, Y, 0.3, color=["b"])
plt.bar(X1, Y1, 0.3, color=["r"])

plt.legend(['蓝色的图', '红色的图'])  # 添加图例

# 4.显示画布
plt.show()
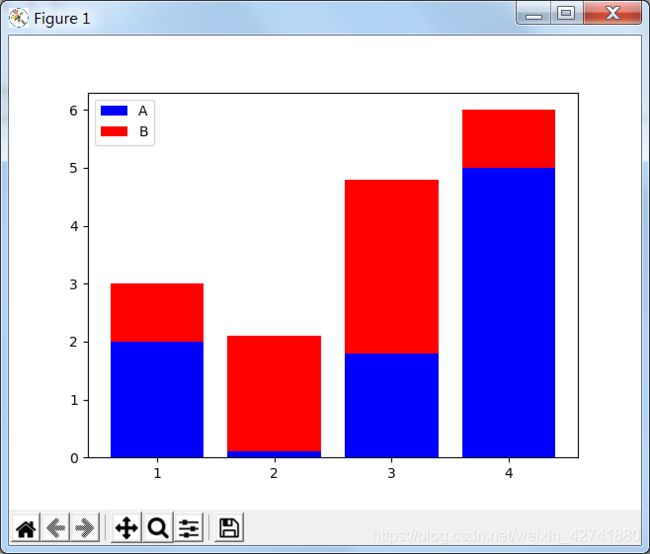
堆积柱状图
# 1.导入库
import matplotlib.pyplot as plt

# 2.设置值
name_list = ['1', '2', '3', '4']
num_list = [2, 0.1, 1.8, 5]
num_list1 = [1, 2, 3, 1]

# 3.画布设置
plt.bar(range(len(num_list)), num_list, label='A', fc='b')
plt.bar(range(len(num_list)), num_list1, bottom=num_list, label='B', tick_label=name_list, fc='r')

# 4.显示画布
plt.legend()
plt.show()
三层堆积柱状图
# 1.导入库
import matplotlib.pyplot as plt

# 2.设置值
name_list = ['1', '2', '3', '4']
num_list = [2, 0.1, 1.8, 5]
num_list1 = [1, 2, 3, 1]
num_list2 = [2, 4, 1, 4]

num_list3 = [num_list[i]+num_list1[i] for i in range(0, len(num_list1))]  # 与两层不同的是,需要计算出三层的高度赋值给num_list3

# 3.画布设置
plt.bar(range(len(num_list)), num_list, label='A', fc='b')
plt.bar(range(len(num_list)), num_list1, bottom=num_list, label='B', tick_label=name_list, fc='r')
plt.bar(range(len(num_list)), num_list2, bottom=num_list3, label='C', fc='g')

# 4.显示画布
plt.legend()
plt.show()
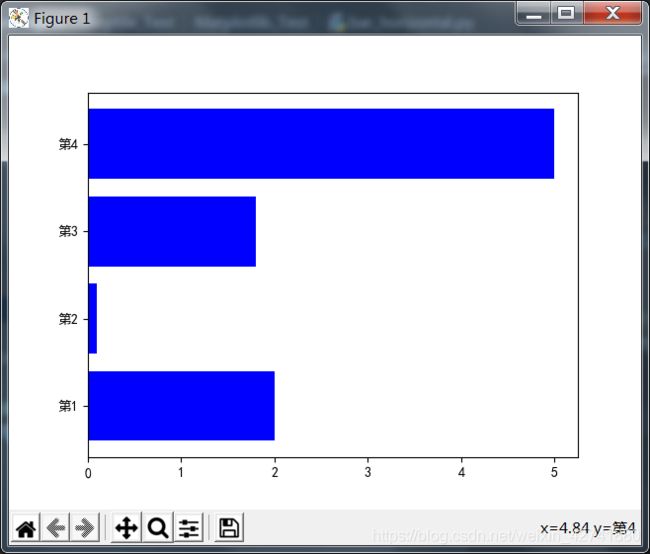
水平条形图
# 1.导入库
import matplotlib.pyplot as plt

# 2.设置值
name_list = ['第1', '第2', '第3', '第4']
num_list = [2, 0.1, 1.8, 5]

# 3.画布设置
plt.rcParams['font.sans-serif'] = ['SimHei']  # 正常显示中文汉字
plt.barh(name_list, num_list, label='A', fc='b')

# 4.显示画布
plt.show()
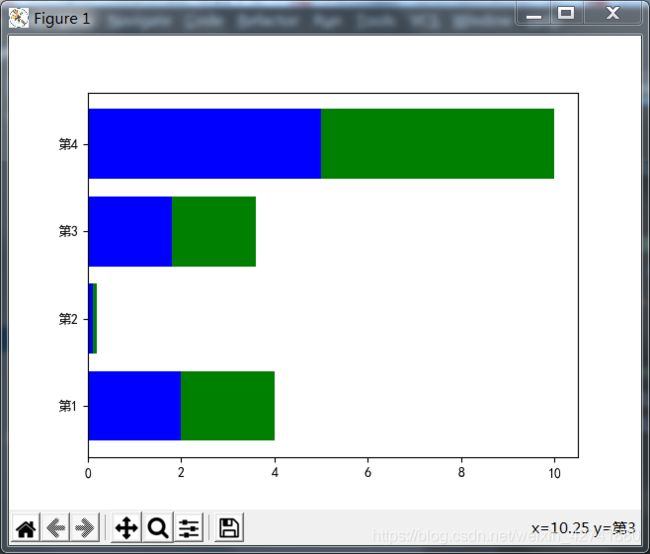
水平堆积条形图
# 1.导入库
import matplotlib.pyplot as plt

# 2.设置值
name_list = ['第1', '第2', '第3', '第4']
num_list = [2, 0.1, 1.8, 5]
num_list1 = [2, 0.1, 1.8, 5]

# 3.画布设置
plt.rcParams['font.sans-serif'] = ['SimHei']  # 正常显示中文汉字
plt.barh(name_list, num_list, align="center", label='A', fc='b')
plt.barh(name_list, num_list1, left=num_list, label='A1', fc='g')

# 4.显示画布
plt.show()
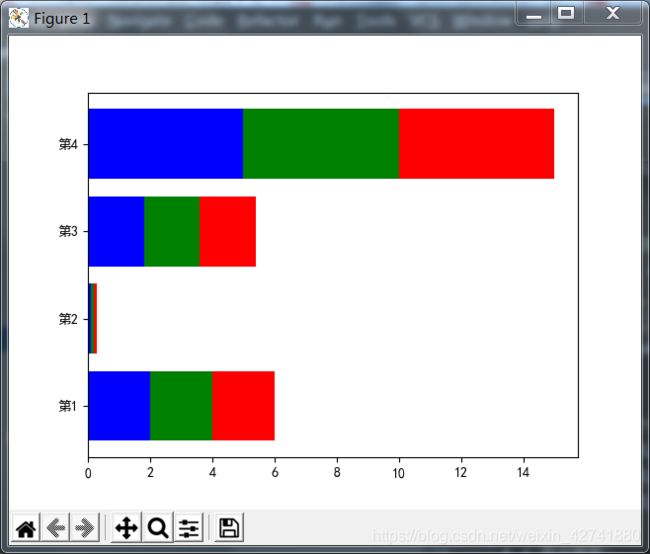
水平三层堆积条形图
# 1.导入库
import matplotlib.pyplot as plt

# 2.设置值
name_list = ['第1', '第2', '第3', '第4']
num_list = [2, 0.1, 1.8, 5]
num_list1 = [2, 0.1, 1.8, 5]
num_list2 = [2, 0.1, 1.8, 5]
num_list3 = [num_list[i]+num_list1[i] for i in range(0, len(num_list1))]

# 3.画布设置
plt.rcParams['font.sans-serif'] = ['SimHei']  # 正常显示中文汉字
plt.barh(name_list, num_list, align="center", label='A', fc='b')
plt.barh(name_list, num_list1, left=num_list, label='A1', fc='g')
plt.barh(name_list, num_list2, left=num_list3, label='A2', fc='r')

# 4.显示画布
plt.show()
水平双柱条形图
# 1.导入库
import matplotlib.pyplot as plt

# 2.设置值
name_list = [0.8, 1.8, 2.8, 3.8]
name_list1 = [1.2, 2.2, 3.2, 4.2]
num_list = [2, 0.1, 1.8, 5]
num_list1 = [2, 0.1, 1.8, 5]

# 3.画布设置
plt.ylim(0, 5)  # 设置y轴取值范围
plt.barh(name_list, num_list, 0.3,  label='A', fc='b')
plt.barh(name_list1, num_list1, 0.3, label='A1', fc='g')

# 4.显示画布
plt.show()
