matplot画图总结
1、基本图
import matplotlib.pyplot as plt
import numpy as np
plt.figure()
plt.plot(x, y,'--')
plt.title("Matplotlib demo")
plt.xlabel("x axis caption")
plt.ylabel("y axis caption")
plt.show()
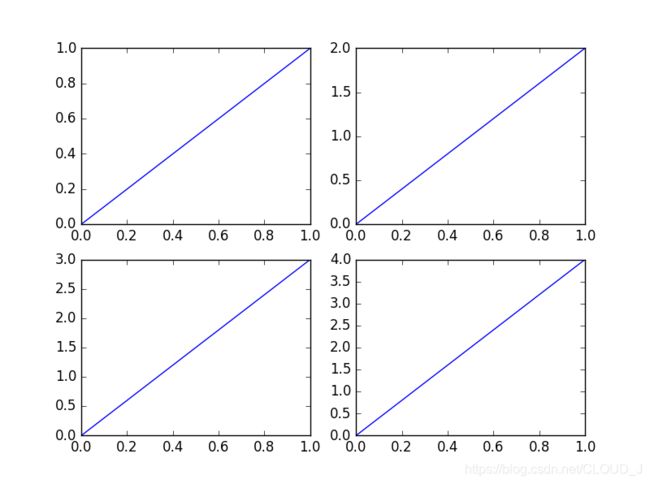
2、多图
plt.subplot(2,2,1)
plt.plot([0,1],[0,1])
plt.subplot(2,2,2)
plt.plot([0,1],[0,2])
plt.subplot(223)
plt.plot([0,1],[0,3])
3、不均匀图
plt.subplot(2,1,1)
plt.plot([0,1],[0,1])
plt.subplot(2,3,4)
plt.plot([0,1],[0,2])

