第十九章 python 数据可视化 Matplotlib Pygal
python 数据可视化
- 一、使用Matplotlib生成数据图
- 1. matplotlib画图中文乱码小方框的解决方法
- 2. 知识点
- 3. 安装Matplotlib包
- 4. Matplotlib数据图入门(折线图plot())
- (1)单条折线图
- (2)多条折线图
- 5. 管理图例
- 6. 管理坐标轴
- 7. 管理多个子图
- 二、功能丰富的数据图
- 1. 饼图(pie())
- 2. 柱状图(bar())
- 3. 水平柱状图(barh())
- 4. 散点图(scatter())
- 5. 等高线图(contour())
- 6. 3D图形(plot_surface())
- 三、使用Pygal生成数据图
- 1. 安装Pygal包
- 2. Pygal数据图入门
- 3. 配置Pygal数据图(柱状图(pygal.Bar()))
- 四、Pygal支持的常见数据图
- 1. 折线图(pygal.Lin())
- 2. 水平柱状图和水平折线图(pygal.HorizontalBar())
- 3. 叠加柱状图和叠加折线图(pygal.StackedBar())
- 4. 饼图(pygal.Pie)
- 5. 点图(pygal.Dot)
- 6. 仪表图(pygal.Gauge)
- 7 . 雷达图(pygal.Radar)
- 五、处理数据
- 1. CSV文件格式
- 2. JSON数据
- 3. 数据清洗
- 4. 读取网络数据
一、使用Matplotlib生成数据图
1. matplotlib画图中文乱码小方框的解决方法
链接:https://blog.csdn.net/HappyRocking/article/details/91491107
链接:https://blog.csdn.net/qq_36556893/article/details/90145177
新细明体:PMingLiU
细明体:MingLiU
标楷体:DFKai-SB
黑体:SimHei
宋体:SimSun
新宋体:NSimSun
仿宋:FangSong
楷体:KaiTi
仿宋_GB2312:FangSong_GB2312
楷体_GB2312:KaiTi_GB2312
微软正黑体:Microsoft JhengHei
微软雅黑体:Microsoft YaHei
import matplotlib.pyplot as plt
plt.rcParams['font.sans-serif']=['simhei']


import matplotlib
import matplotlib.pyplot as plt
import matplotlib.font_manager as fm
plt.rcParams['font.sans-serif']=['KaiTi']
plt.rcParams['axes.unicode_minus'] = False

# 使用Matplotlib的字体管理器加载中文字体
my_font=fm.FontProperties(fname="C:\Windows\Fonts\msyh.ttf")
plt.legend(labels=['疯狂Java讲义年销量', '疯狂Android讲义年销量'],
    loc='lower right', prop=my_font)
2. 知识点
pyplot子模块下的plot()函数
color :颜色
linewidth :宽度
linestyle :样式(线)
linestyle 折现样式:
- -:代表实线,这是默认值。
- –:代表虚线。
- ::代表点线。
- -.:代表短线、点相间的虚线。
legend()函数来实现图例
第一个list参数(handles参数)用于引用折线图上的每条折现;
第二个list参数(labels)代表为每条折线所添加的图例;
fm.FontProperties(类)=“字体位置”:字体管理器加载中文字体
loc参数:指定图例的添加位置,支持如下参数值:
- ‘best’:自动选择最佳位置。
- 'upper right,:将图例放在右上角。
- ‘upper left’:将图例放在左上角。
- ‘lower left’:将图例放在左下角。
- ‘lower right’:将图例放在右下角。
- ‘right’:将图例放在右边。
- ‘centerleft’:将图例放在左边居中的位置。
- ‘centerright’:将图例放在右边居中的位置。
- 'lowercenter*:将图例放在底部居中的位置。
- 'uppercenter*:将图例放在顶部居中的位置。
- ‘center’:将图例放在中心。
prop属性指定使用中文字体。
xlable()函数设置X轴的名称
ylabel()函数设置Y轴的名称
title()函数设置整个数据图的标题
xticks()函数改变X轴的刻度值(允许使用文本作为刻度值)
yticks()函数改变Y轴的刻度值(允许使用文本作为刻度值)
gca()函数:获取坐标轴信息对象,然后对坐标轴进行控制。
ax.xaxis.set_ticks_position(‘bottom’):设置将X轴的刻度值放在底部X轴上
ax.yaxis.set_ticks_position(‘left’):设置将Y轴的刻度值放在底部X轴上
ax.spines[‘right’].set_color(‘none’):设置右边坐标轴线的颜色(设置为none表示不显示)
ax.spines[‘top’].set_color(‘none’):设置顶部坐标轴线的颜色(设置为none表示不显示)
ax.spines[‘bottom’].set_position((‘data’, 70000)):定义底部坐标轴线的位置(放在70000数值处)
调用subplot()函数可以创建一个子图,然后程序就可以在子图上进行绘制。subplot(nrows, ncols,index, **kwargs)函数
nrows参数指定将数据图区域分成多少行:
ncols参数指定将数据图区域分成多少列;
index参数指定获取第几个区域。
使用GridSpec对绘图区域进行分割。
3. 安装Matplotlib包
pip install matplotlib
pip install Matplotlib --user -i https://pypi.douban.com/simple
python -m pip install matplotlib
pydoc 查看文档
python -m pydoc -p 8899
4. Matplotlib数据图入门(折线图plot())
pyplot子模块下的plot()函数
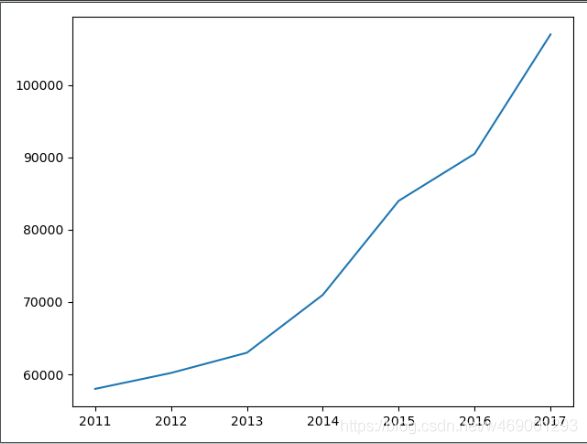
(1)单条折线图
代码如下:
import matplotlib.pyplot as plt

# 定义2个列表分别作为X轴、Y轴数据
x_data = ['2011', '2012', '2013', '2014', '2015', '2016', '2017']
y_data = [58000, 60200, 63000, 71000, 84000, 90500, 107000]
# 第一个列表代表横坐标的值,第二个代表纵坐标的值
#plt.plot(x_data, y_data)
plt.plot(y_data)
# 调用show()函数显示图形
plt.show()
(2)多条折线图
代码如下:
import matplotlib.pyplot as plt

x_data = ['2011', '2012', '2013', '2014', '2015', '2016', '2017']
# 定义2个列表分别作为两条折线的Y轴数据
y_data = [58000, 60200, 63000, 71000, 84000, 90500, 107000]
y_data2 = [52000, 54200, 51500,58300, 56800, 59500, 62700]
# 传入2组分别代表X轴、Y轴的数据
#plt.plot(x_data, y_data, x_data, y_data2)
plt.plot(x_data, y_data)
plt.plot(x_data, y_data2)
# 调用show()函数显示图形
plt.show()

color :颜色
linewidth :宽度
linestyle :样式(线)
linestyle 折现样式:
- -:代表实线,这是默认值。
- –:代表虚线。
- ::代表点线。
- -.:代表短线、点相间的虚线。
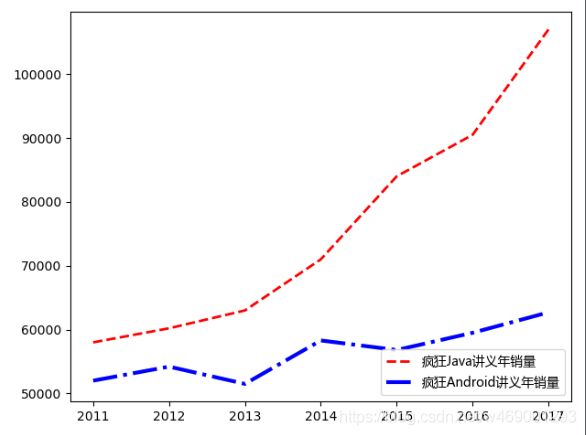
代码如下:
import matplotlib.pyplot as plt

x_data = ['2011', '2012', '2013', '2014', '2015', '2016', '2017']
# 定义2个列表分别作为两条折线的Y轴数据
y_data = [58000, 60200, 63000, 71000, 84000, 90500, 107000]
y_data2 = [52000, 54200, 51500,58300, 56800, 59500, 62700]
# 指定折线的颜色、线宽和样式
plt.plot(x_data, y_data, color = 'red', linewidth = 2.0, linestyle = '--')
plt.plot(x_data, y_data2, color = 'blue', linewidth = 3.0, linestyle = '-.')
# 调用show()函数显示图形
plt.show()
5. 管理图例
legend()函数来实现图例
第一个list参数(handles参数)用于引用折线图上的每条折现;
第二个list参数(labels)代表为每条折线所添加的图例;
fm.FontProperties(类)=“字体位置”:字体管理器加载中文字体
loc参数:指定图例的添加位置,支持如下参数值:
- ‘best’:自动选择最佳位置。
- 'upper right,:将图例放在右上角。
- ‘upper left’:将图例放在左上角。
- ‘lower left’:将图例放在左下角。
- ‘lower right’:将图例放在右下角。
- ‘right’:将图例放在右边。
- ‘centerleft’:将图例放在左边居中的位置。
- ‘centerright’:将图例放在右边居中的位置。
- 'lowercenter*:将图例放在底部居中的位置。
- 'uppercenter*:将图例放在顶部居中的位置。
- ‘center’:将图例放在中心。
prop属性指定使用中文字体。
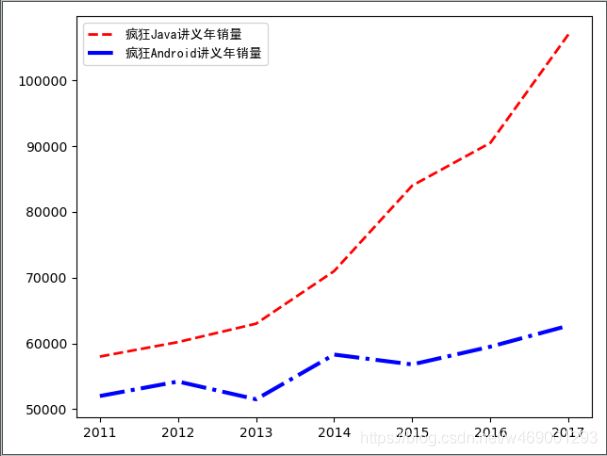
代码如下:
import matplotlib.pyplot as plt


x_data = ['2011', '2012', '2013', '2014', '2015', '2016', '2017']
# 定义2个列表分别作为两条折线的Y轴数据
y_data = [58000, 60200, 63000, 71000, 84000, 90500, 107000]
y_data2 = [52000, 54200, 51500,58300, 56800, 59500, 62700]
# 指定折线的颜色、线宽和样式
ln1, = plt.plot(x_data, y_data, color = 'red', linewidth = 2.0, linestyle = '--')
ln2, = plt.plot(x_data, y_data2, color = 'blue', linewidth = 3.0, linestyle = '-.')
import matplotlib.font_manager as fm
# 使用Matplotlib的字体管理器加载中文字体
my_font=fm.FontProperties(fname="C:\Windows\Fonts\msyh.ttf")
# 调用legend函数设置图例
#plt.legend(handles=[ln2, ln1], labels=['疯狂Android讲义年销量', '疯狂Java讲义年销量'],
#    loc='lower right', prop=my_font)
plt.legend(labels=['疯狂Java讲义年销量', '疯狂Android讲义年销量'],
    loc='lower right', prop=my_font)
# 调用show()函数显示图形
plt.show()
代码如下:
import matplotlib.pyplot as plt

x_data = ['2011', '2012', '2013', '2014', '2015', '2016', '2017']
# 定义2个列表分别作为两条折线的Y轴数据
y_data = [58000, 60200, 63000, 71000, 84000, 90500, 107000]
y_data2 = [52000, 54200, 51500,58300, 56800, 59500, 62700]
# 指定折线的颜色、线宽和样式
plt.plot(x_data, y_data, color = 'red', linewidth = 2.0,
    linestyle = '--', label='疯狂Java讲义年销量')
plt.plot(x_data, y_data2, color = 'blue', linewidth = 3.0,
    linestyle = '-.', label='疯狂Android讲义年销量')
import matplotlib.font_manager as fm
# 使用Matplotlib的字体管理器加载中文字体
my_font=fm.FontProperties(fname="C:\Windows\Fonts\SimHei_0.ttf")

# 调用legend函数设置图例
plt.legend(loc='best', prop=my_font)
# 调用show()函数显示图形
plt.show()
6. 管理坐标轴
xlable()函数设置X轴的名称
ylabel()函数设置Y轴的名称
title()函数设置整个数据图的标题
xticks()函数改变X轴的刻度值(允许使用文本作为刻度值)
yticks()函数改变Y轴的刻度值(允许使用文本作为刻度值)
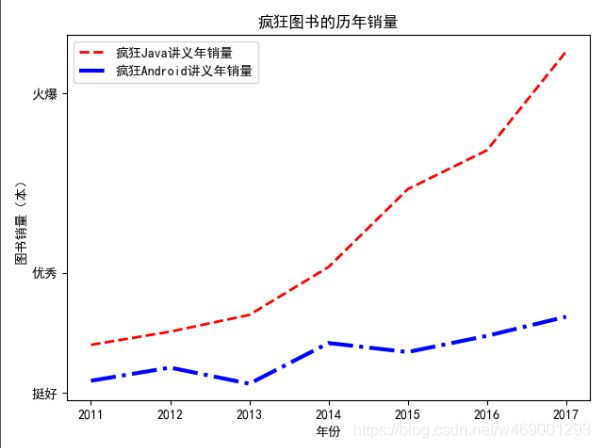
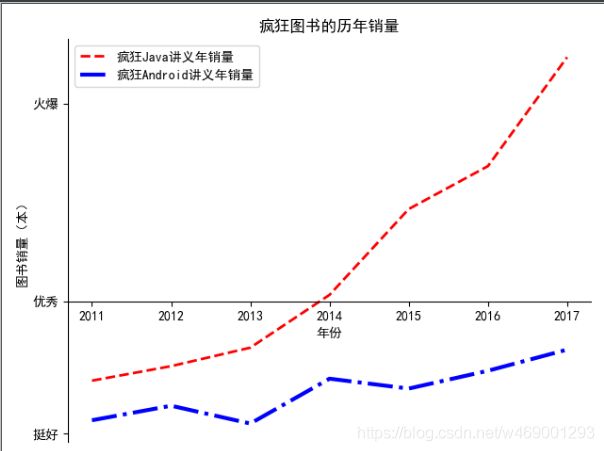
代码如下:
import matplotlib.pyplot as plt
plt.rcParams['font.sans-serif']=['simhei']
plt.rcParams['axes.unicode_minus'] = False

x_data = ['2011', '2012', '2013', '2014', '2015', '2016', '2017']
# 定义2个列表分别作为两条折线的Y轴数据
y_data = [58000, 60200, 63000, 71000, 84000, 90500, 107000]
y_data2 = [52000, 54200, 51500,58300, 56800, 59500, 62700]
# 指定折线的颜色、线宽和样式
plt.plot(x_data, y_data, color = 'red', linewidth = 2.0,
    linestyle = '--', label='疯狂Java讲义年销量')
plt.plot(x_data, y_data2, color = 'blue', linewidth = 3.0,
    linestyle = '-.', label='疯狂Android讲义年销量')
# 调用legend函数设置图例
plt.legend(loc='best')
# 设置两条坐标轴的名字
plt.xlabel("年份")
plt.ylabel("图书销量(本)")
# 设置数据图的标题
plt.title('疯狂图书的历年销量')
# 设置Y轴上的刻度值
# 第一个参数是点的位置,第二个参数是点的文字提示
plt.yticks([50000, 70000, 100000],
    [r'挺好', r'优秀', r'火爆'])
# 调用show()函数显示图形
plt.show()
gca()函数:获取坐标轴信息对象,然后对坐标轴进行控制。
ax.xaxis.set_ticks_position('bottom'):设置将X轴的刻度值放在底部X轴上
ax.yaxis.set_ticks_position('left'):设置将Y轴的刻度值放在底部X轴上
ax.spines['right'].set_color('none'):设置右边坐标轴线的颜色(设置为none表示不显示)
ax.spines['top'].set_color('none'):设置顶部坐标轴线的颜色(设置为none表示不显示)
ax.spines['bottom'].set_position(('data', 70000)):定义底部坐标轴线的位置(放在70000数值处)
代码如下:
import matplotlib.pyplot as plt
plt.rcParams['font.sans-serif']=['simhei']
plt.rcParams['axes.unicode_minus'] = False

x_data = ['2011', '2012', '2013', '2014', '2015', '2016', '2017']
# 定义2个列表分别作为两条折线的Y轴数据
y_data = [58000, 60200, 63000, 71000, 84000, 90500, 107000]
y_data2 = [52000, 54200, 51500,58300, 56800, 59500, 62700]
# 指定折线的颜色、线宽和样式
plt.plot(x_data, y_data, color = 'red', linewidth = 2.0,
    linestyle = '--', label='疯狂Java讲义年销量')
plt.plot(x_data, y_data2, color = 'blue', linewidth = 3.0,
    linestyle = '-.', label='疯狂Android讲义年销量')
import matplotlib.font_manager as fm
# 使用Matplotlib的字体管理器加载中文字体
my_font=fm.FontProperties(fname="C:\Windows\Fonts\msyh.ttf")
# 调用legend函数设置图例
plt.legend(loc='best')
# 设置两条坐标轴的名字
plt.xlabel("年份")
plt.ylabel("图书销量(本)")
# 设置数据图的标题
plt.title('疯狂图书的历年销量')
# 设置Y轴上的刻度值
# 第一个参数是点的位置,第二个参数是点的文字提示
plt.yticks([50000, 70000, 100000],
    [r'挺好', r'优秀', r'火爆'])
ax = plt.gca()
# 设置将X轴的刻度值放在底部X轴上
ax.xaxis.set_ticks_position('bottom')
# 设置将Y轴的刻度值放在底部X轴上
ax.yaxis.set_ticks_position('left')
# 设置右边坐标轴线的颜色(设置为none表示不显示)
ax.spines['right'].set_color('none')
# 设置顶部坐标轴线的颜色(设置为none表示不显示)
ax.spines['top'].set_color('none')

# 定义底部坐标轴线的位置(放在70000数值处)
ax.spines['bottom'].set_position(('data', 70000))

# 调用show()函数显示图形
plt.show()
7. 管理多个子图
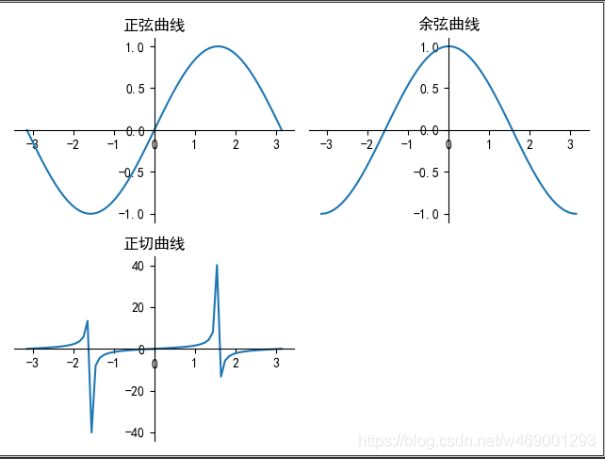
调用subplot()函数可以创建一个子图,然后程序就可以在子图上进行绘制。subplot(nrows, ncols,index, **kwargs)函数
nrows参数指定将数据图区域分成多少行:
ncols参数指定将数据图区域分成多少列;
index参数指定获取第几个区域。
代码如下:
import matplotlib.pyplot as plt
import numpy as np
plt.rcParams['font.sans-serif']=['simhei']
plt.rcParams['axes.unicode_minus'] = False

plt.figure()
# 定义从-pi到pi之间的数据,平均取64个数据点
x_data = np.linspace(-np.pi, np.pi, 64, endpoint=True)  # ①
# 将整个figure分成两行两列,第三个参数表示该图形放在第1个网格
plt.subplot(2, 2, 1)
# 绘制正弦曲线
plt.plot(x_data, np.sin(x_data))
plt.gca().spines['right'].set_color('none')
plt.gca().spines['top'].set_color('none')
plt.gca().spines['bottom'].set_position(('data', 0))
plt.gca().spines['left'].set_position(('data', 0))
plt.title('正弦曲线')

# 将整个figure分成两行两列,并将该图形放在第2个网格
plt.subplot(222)
# 绘制余弦曲线
plt.plot(x_data, np.cos(x_data))
plt.gca().spines['right'].set_color('none')
plt.gca().spines['top'].set_color('none')
plt.gca().spines['bottom'].set_position(('data', 0))
plt.gca().spines['left'].set_position(('data', 0))
plt.title('余弦曲线')

# 将整个figure分成两行两列,并该图形放在第3个网格
plt.subplot(223)
# 绘制正切曲线
plt.plot(x_data, np.tan(x_data))
plt.gca().spines['right'].set_color('none')
plt.gca().spines['top'].set_color('none')
plt.gca().spines['bottom'].set_position(('data', 0))
plt.gca().spines['left'].set_position(('data', 0))
plt.title('正切曲线')

plt.show()
第一个图占用两个网格
代码如下:
import matplotlib.pyplot as plt
import numpy as np
plt.rcParams['font.sans-serif']=['simhei']
plt.rcParams['axes.unicode_minus'] = False

plt.figure()
# 定义从-pi到pi之间的数据,平均取64个数据点
x_data = np.linspace(-np.pi, np.pi, 64, endpoint=True)  # ①
# 将整个figure分成两行一列,第三个参数表示该图形放在第1个网格
plt.subplot(2, 1, 1)
# 绘制正弦曲线
plt.plot(x_data, np.sin(x_data))
plt.gca().spines['right'].set_color('none')
plt.gca().spines['top'].set_color('none')
plt.gca().spines['bottom'].set_position(('data', 0))
plt.gca().spines['left'].set_position(('data', 0))
plt.title('正弦曲线')

# 将整个figure分成两行两列,并将该图形放在第4个网格
plt.subplot(223)
# 绘制余弦曲线
plt.plot(x_data, np.cos(x_data))
plt.gca().spines['right'].set_color('none')
plt.gca().spines['top'].set_color('none')
plt.gca().spines['bottom'].set_position(('data', 0))
plt.gca().spines['left'].set_position(('data', 0))
plt.title('余弦曲线')

# 将整个figure分成两行两列,并该图形放在第4个网格
plt.subplot(224)
# 绘制正切曲线
plt.plot(x_data, np.tan(x_data))
plt.gca().spines['right'].set_color('none')
plt.gca().spines['top'].set_color('none')
plt.gca().spines['bottom'].set_position(('data', 0))
plt.gca().spines['left'].set_position(('data', 0))
plt.title('正切曲线')

plt.show()
使用GridSpec对绘图区域进行分割。
代码如下:
import matplotlib.pyplot as plt
import numpy as np
import matplotlib.gridspec as gridspec

plt.figure()
# 定义从-pi到pi之间的数据,平均取64个数据点
x_data = np.linspace(-np.pi, np.pi, 64, endpoint=True)  # ①

# 将绘图区域分成2行3列
gs = gridspec.GridSpec(2, 3)
# 指定ax1占用第一行(0)整行
ax1 = plt.subplot(gs[0, :])
# 指定ax1占用第二行(1)的第一格(第二个参数0代表)
ax2 = plt.subplot(gs[1, 0])
# 指定ax1占用第二行(1)的第二、三格(第二个参数0代表)
ax3 = plt.subplot(gs[1, 1:3])

# 绘制正弦曲线
ax1.plot(x_data, np.sin(x_data))
ax1.spines['right'].set_color('none')
ax1.spines['top'].set_color('none')
ax1.spines['top'].set_color('none')
ax1.spines['bottom'].set_position(('data', 0))
ax1.spines['left'].set_position(('data', 0))
ax1.set_title('正弦曲线')

# 绘制余弦曲线
ax2.plot(x_data, np.cos(x_data))
ax2.spines['right'].set_color('none')
ax2.spines['top'].set_color('none')
ax2.spines['bottom'].set_position(('data', 0))
ax2.spines['left'].set_position(('data', 0))
ax2.set_title('余弦曲线')

# 绘制正切曲线
ax3.plot(x_data, np.tan(x_data))
ax3.spines['right'].set_color('none')
ax3.spines['top'].set_color('none')
ax3.spines['bottom'].set_position(('data', 0))
ax3.spines['left'].set_position(('data', 0))
ax3.set_title('正切曲线')

plt.show()
二、功能丰富的数据图
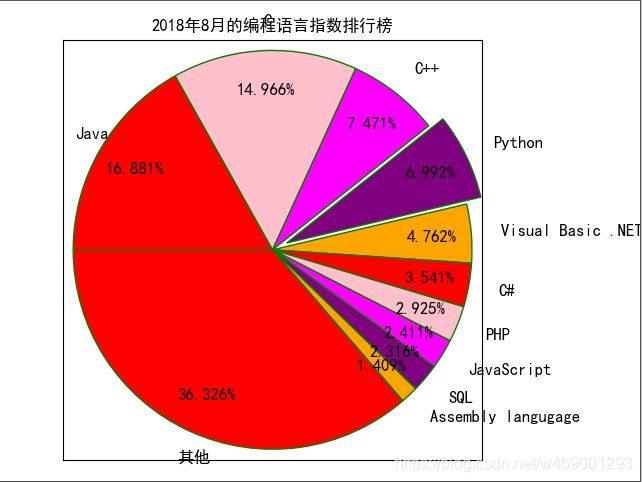
1. 饼图(pie())
pie()函数绘制饼图
绘图数据:x(x=data)
添加编程语言标签:labels
突出显示Python:explode
设置饼图的自定义填充色:colors
设置百分比的格式,此处保留3位小数:autopct=’%.3f%%’
设置百分比标签与圆心的距离:pctdistance=0.8
设置标签与圆心的距离:labeldistance = 1.15
设置饼图的初始角度:startangle = 180
设置饼图的圆心(相当于X轴和Y轴的范围):center = (4, 4)
设置饼图的半径(相当于X轴和Y轴的范围):radius = 3.8
是否逆时针,这里设置为顺时针方向:counterclock = False
设置饼图内外边界的属性值:wedgeprops = {‘linewidth’: 1, ‘edgecolor’:‘green’}
设置文本标签的属性值:textprops = {‘fontsize’:12, ‘color’:‘black’}
是否显示饼图的圆圈,此处设为显示:frame = 1
代码如下:
import matplotlib.pyplot as plt
plt.rcParams['font.sans-serif']=['simhei']
plt.rcParams['axes.unicode_minus'] = False

# 准备数据
data = [0.16881, 0.14966, 0.07471, 0.06992,
    0.04762, 0.03541, 0.02925, 0.02411, 0.02316, 0.01409, 0.36326]
# 准备标签
labels = ['Java', 'C', 'C++', 'Python',
    'Visual Basic .NET', 'C#', 'PHP', 'JavaScript',
    'SQL', 'Assembly langugage', '其他']
# 将第4个语言(Python)分离出来
explode = [0, 0, 0, 0.3, 0, 0, 0, 0, 0, 0, 0]
# 使用自定义颜色
colors=['red', 'pink', 'magenta','purple','orange']
# 将横、纵坐标轴标准化处理,保证饼图是一个正圆,否则为椭圆
plt.axes(aspect='equal')
# 控制X轴和Y轴的范围(用于控制饼图的圆心,半径)
plt.xlim(0,8)
plt.ylim(0,8)

# 绘制饼图
plt.pie(x = data, # 绘图数据
    labels=labels, # 添加编程语言标签
    explode=explode, # 突出显示Python
    colors=colors, # 设置饼图的自定义填充色
    autopct='%.3f%%', # 设置百分比的格式,此处保留3位小数
    pctdistance=0.8,  # 设置百分比标签与圆心的距离
    labeldistance = 1.15, # 设置标签与圆心的距离
    startangle = 180, # 设置饼图的初始角度
    center = (4, 4), # 设置饼图的圆心(相当于X轴和Y轴的范围)
    radius = 3.8, # 设置饼图的半径(相当于X轴和Y轴的范围)
    counterclock = False, # 是否逆时针,这里设置为顺时针方向
    wedgeprops = {'linewidth': 1, 'edgecolor':'green'},# 设置饼图内外边界的属性值
    textprops = {'fontsize':12, 'color':'black'}, # 设置文本标签的属性值
    frame = 1) # 是否显示饼图的圆圈,此处设为显示
# 不显示X轴和Y轴的刻度值
plt.xticks(())
plt.yticks(())
# 添加图标题
plt.title('2018年8月的编程语言指数排行榜')
# 显示图形
plt.show()
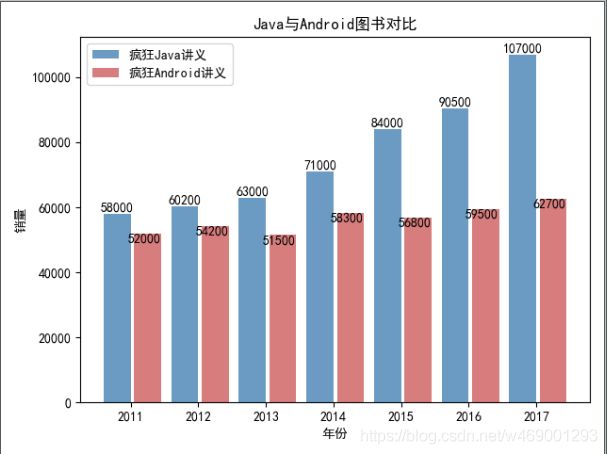
2. 柱状图(bar())
柱形图重叠
bar()函数绘制柱形图
透明度:alpha=0.8(0-1之间)
text()函数在数据图上输出文字:
前两个参数控制输出文字的X、Y坐标,第三个参数则控制输出的内容。
对于Y坐标而言,条柱的数值正好在条柱高度所在处,如果指定Y坐标为条柱的数值+100,就是控制将文字输出到条柱略上一点的位置。
水平对齐方式:ha=‘center’
垂直对齐方式:va=‘bottom’
代码如下:
import matplotlib.pyplot as plt
import numpy as np
plt.rcParams['font.sans-serif']=['simhei']
plt.rcParams['axes.unicode_minus'] = False

# 构建数据
x_data = ['2011', '2012', '2013', '2014', '2015', '2016', '2017']
y_data = [58000, 60200, 63000, 71000, 84000, 90500, 107000]
y_data2 = [52000, 54200, 51500,58300, 56800, 59500, 62700]
# 绘图
plt.bar(x=x_data, height=y_data, label='疯狂Java讲义', color='steelblue', alpha=0.8)
plt.bar(x=x_data, height=y_data2, label='疯狂Android讲义', color='indianred', alpha=0.8)
# 在柱状图上显示具体数值, ha参数控制水平对齐方式, va控制垂直对齐方式
for x, y in enumerate(y_data):
    plt.text(x, y + 100, '%s' % y, ha='center', va='bottom')
for x, y in enumerate(y_data2):
    plt.text(x, y + 100, '%s' % y, ha='center', va='top')
# 设置标题
plt.title("Java与Android图书对比")
# 为两条坐标轴设置名称
plt.xlabel("年份")
plt.ylabel("销量")
# 显示图例
plt.legend()
plt.show()
柱形图不重叠(width参数)
代码如下:
import matplotlib.pyplot as plt
import numpy as np
plt.rcParams['font.sans-serif']=['simhei']
plt.rcParams['axes.unicode_minus'] = False

# 构建数据
x_data = ['2011', '2012', '2013', '2014', '2015', '2016', '2017']
y_data = [58000, 60200, 63000, 71000, 84000, 90500, 107000]
y_data2 = [52000, 54200, 51500,58300, 56800, 59500, 62700]
bar_width=0.3
# 将X轴数据改为使用range(len(x_data), 就是0、1、2...
plt.bar(x=range(len(x_data)), height=y_data, label='疯狂Java讲义',
    color='steelblue', alpha=0.8, width=bar_width)
# 将X轴数据改为使用np.arange(len(x_data))+bar_width,
# 就是bar_width、1+bar_width、2+bar_width...这样就和第一个柱状图并列了
#plt.bar(x=np.arange(len(x_data))+bar_width, height=y_data2,
#    label='疯狂Android讲义', color='indianred', alpha=0.8, width=bar_width)
plt.bar(x=np.arange(len(x_data))+bar_width+0.05, height=y_data2,
    label='疯狂Android讲义', color='indianred', alpha=0.8, width=bar_width)
# 在柱状图上显示具体数值, ha参数控制水平对齐方式, va控制垂直对齐方式
for x, y in enumerate(y_data):
    plt.text(x, y + 100, '%s' % y, ha='center', va='bottom')
for x, y in enumerate(y_data2):
    plt.text(x+bar_width, y + 100, '%s' % y, ha='center', va='top')
# 为X轴设置刻度值
plt.xticks(np.arange(len(x_data))+bar_width/2, x_data)
# 设置标题
plt.title("Java与Android图书对比")
# 为两条坐标轴设置名称
plt.xlabel("年份")
plt.ylabel("销量")
# 显示图例
plt.legend()
plt.show()
3. 水平柱状图(barh())
barh()函数生成水平柱状图
代码如下:
import matplotlib.pyplot as plt
import numpy as np
plt.rcParams['font.sans-serif']=['simhei']
plt.rcParams['axes.unicode_minus'] = False

# 构建数据
x_data = ['2011', '2012', '2013', '2014', '2015', '2016', '2017']
y_data = [58000, 60200, 63000, 71000, 84000, 90500, 107000]
y_data2 = [52000, 54200, 51500,58300, 56800, 59500, 62700]
bar_width=0.3
# Y轴数据使用range(len(x_data), 就是0、1、2...
plt.barh(y=range(len(x_data)), width=y_data, label='疯狂Java讲义',
    color='steelblue', alpha=0.8, height=bar_width)
# Y轴数据使用np.arange(len(x_data))+bar_width,
# 就是bar_width、1+bar_width、2+bar_width...这样就和第一个柱状图并列了
plt.barh(y=np.arange(len(x_data))+bar_width, width=y_data2,
    label='疯狂Android讲义', color='indianred', alpha=0.8, height=bar_width)

# 在柱状图上显示具体数值, ha参数控制水平对齐方式, va控制垂直对齐方式
for y, x in enumerate(y_data):
    plt.text(x+5000, y-bar_width/2, '%s' % x, ha='center', va='bottom')
for y, x in enumerate(y_data2):
    plt.text(x+5000, y+bar_width/2, '%s' % x, ha='center', va='bottom')
# 为Y轴设置刻度值
plt.yticks(np.arange(len(x_data))+bar_width/2, x_data)
# 设置标题
plt.title("Java与Android图书对比")
# 为两条坐标轴设置名称
plt.xlabel("销量")
plt.ylabel("年份")
# 显示图例
plt.legend()
plt.show()
4. 散点图(scatter())
scatter()函数绘制散点图
常用参数:
- x:指定X轴数据。
- y:指定F轴数据。
- s:指定散点的大小。
- c:指定散点的颜色。
- alpha:指定散点的透明度。
- linewidths:指定散点边框线的宽度。
- edgecolors:指定散点边框的颜色。
- marker:指定散点的图形样式。
- 该参数支持:
- ‘.’(点标记)
- ‘,’ (像素标记)
- ‘o’ (圆形标记)
- ‘v’ (向下三角形标记)
- ‘^’(向上三角形标记)
- ‘<’ (向左三角形标记)
- ‘>’(向右三角形标记)
- 1 (向下三叉标记)
- 2 (向上三叉标记)
- 3 (向左三叉标记)
- 4 (向右三叉标记)
- ‘s’(正方形标记)
- ‘p’(五边形标记)
- '* '(星形标记)
- ‘h’ (八边形标记)
- 'H '(另一种八边形标记)
- ‘+’(加号标记)
- ‘x’ (x标记)
- ‘D’ (菱形标记)
- ‘d’(尖菱形标记)
- ‘|’ (竖线标记)
- ‘_’(横线标记)等值。
- cmap:指定散点的颜色映射,会使用不同的颜色来区分散点的值。
代码如下:
import matplotlib.pyplot as plt
import numpy as np
plt.rcParams['font.sans-serif']=['simhei']
plt.rcParams['axes.unicode_minus'] = False

plt.figure()
# 定义从-pi到pi之间的数据,平均取64个数据点
x_data = np.linspace(-np.pi, np.pi, 64, endpoint=True)  # ①
# 将整个figure分成两行两列,第三个参数表示该图形放在第1个网格
# 沿着正弦曲线绘制散点图
plt.scatter(x_data, np.sin(x_data), c='purple', # 设置点的颜色
#plt.scatter(x_data, np.sin(x_data), cmap=plt.get_cmap('rainbow'), # 设置点的颜色
    s=50, # 设置点半径
    alpha = 0.5, # 设置透明度
    marker='p', # 设置使用五边形标记
    linewidths=1, # 设置边框的线宽
    edgecolors=['green', 'yellow']) # 设置边框的颜色
# 绘制第二个散点图(只包含一个起点),突出起点
plt.scatter(x_data[0], np.sin(x_data)[0], c='red', # 设置点的颜色
    s=150, # 设置点半径
    alpha = 1) # 设置透明度
# 绘制第三个散点图(只包含一个结束点),突出结束点
plt.scatter(x_data[63], np.sin(x_data)[63], c='black', # 设置点的颜色
    s=150, # 设置点半径
    alpha = 1) # 设置透明度
plt.gca().spines['right'].set_color('none')
plt.gca().spines['top'].set_color('none')
plt.gca().spines['bottom'].set_position(('data', 0))
plt.gca().spines['left'].set_position(('data', 0))
plt.title('正弦曲线的散点图')
plt.show()
5. 等高线图(contour())
contour()函数绘制等高线,contourf()函数为等高线图填充颜色
等高线图需要的是三维数据,其中x、y轴数据决定坐标点,还需要对应的高度数据(相当于z轴数据)来决定不同坐标点的高度。
在调用contour()、contourf()函数时可以指定如下常用参数。
- X:指定X轴数据。
- Y:指定Y轴数据。
- Z:指定X、Y坐标对应点的高度数据。
- colors:指定不同高度的等高线的颜色。
- alpha:指定等高线的透明度。
- cmap:指定等高线的颜色映射,即自动使用不同的颜色来区分不同的高度区域。
- linewidths:指定等高线的宽度。
- linestyles:指定等高线的样式。
代码如下:
import matplotlib.pyplot as plt
import numpy as np
plt.rcParams['font.sans-serif']=['simhei']
plt.rcParams['axes.unicode_minus'] = False

delta = 0.025
# 生成代表X轴数据的列表
x = np.arange(-3.0, 3.0, delta)
# 生成代表Y轴数据的列表
y = np.arange(-2.0, 2.0, delta)
# 对x、y数据执行网格化
X, Y = np.meshgrid(x, y)
Z1 = np.exp(-X**2 - Y**2)
Z2 = np.exp(-(X - 1)**2 - (Y - 1)**2)
# 计算Z轴数据(高度数据)
Z = (Z1 - Z2) * 2
# 为等高线图填充颜色, 16指定将等高线分为几部分
plt.contourf(x, y, Z, 16, alpha = 0.75,
    cmap='rainbow')  # 使用颜色映射来区分不同高度的区域
# 绘制等高线
C = plt.contour(x, y, Z, 16,
    colors = 'black', # 指定等高线的颜色
    linewidth = 0.5) # 指定等高线的线宽
# 绘制等高线数据
plt.clabel(C, inline = True, fontsize = 10)
# 去除坐标轴
plt.xticks(())
plt.yticks(())
# 设置标题
plt.title("等高线图")
# 为两条坐标轴设置名称
plt.xlabel("纬度")
plt.ylabel("经度")
plt.show()
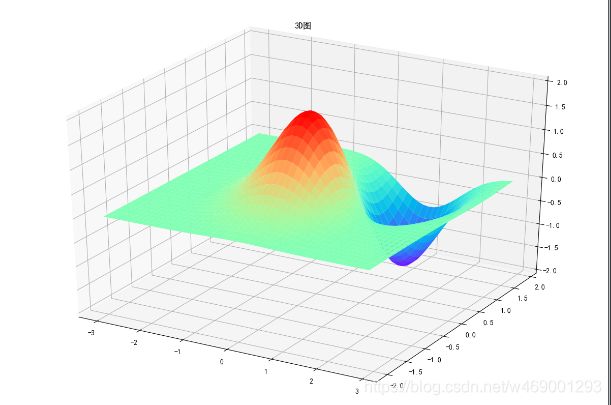
6. 3D图形(plot_surface())
Axes3D对象的plot_surface()方法
代码如下:
import matplotlib.pyplot as plt
import numpy as np
from mpl_toolkits.mplot3d import Axes3D
plt.rcParams['font.sans-serif']=['simhei']
plt.rcParams['axes.unicode_minus'] = False

fig = plt.figure(figsize=(12, 8))
ax = Axes3D(fig)

delta = 0.125
# 生成代表X轴数据的列表
x = np.arange(-3.0, 3.0, delta)
# 生成代表Y轴数据的列表
y = np.arange(-2.0, 2.0, delta)
# 对x、y数据执行网格化
X, Y = np.meshgrid(x, y)
Z1 = np.exp(-X**2 - Y**2)
Z2 = np.exp(-(X - 1)**2 - (Y - 1)**2)
# 计算Z轴数据(高度数据)
Z = (Z1 - Z2) * 2
# 绘制3D图形
ax.plot_surface(X, Y, Z,
    rstride=1,  # rstride(row)指定行的跨度
    cstride=1,  # cstride(column)指定列的跨度
    cmap=plt.get_cmap('rainbow'))  # 设置颜色映射
# 设置Z轴范围
ax.set_zlim(-2, 2)
# 设置标题
plt.title("3D图")
plt.show()
三、使用Pygal生成数据图
1. 安装Pygal包
pip install Pygal --user -i https://pypi.douban.com/simple
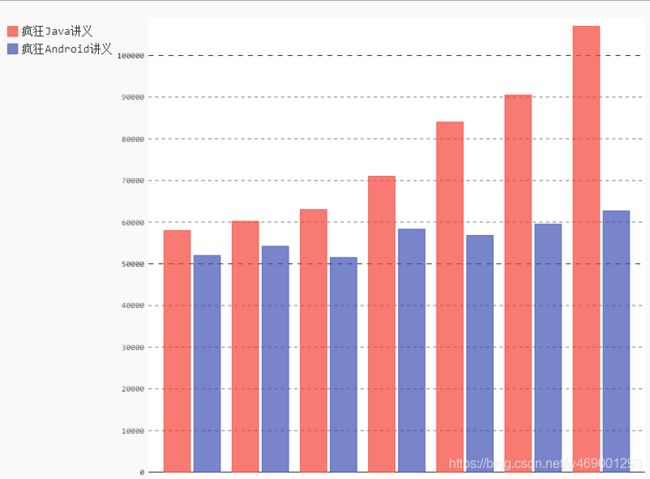
2. Pygal数据图入门
使用Pygal生成数据图的步骤大致如下。
①创建Pygal数据图对象。Pygal为不同的数据图提供了不同的类,比如柱状图使用pygal.Bar类,饼图使用pygaLPie类,折线图使用pygal.Line类,等等。
②调用数据图对象的add()方法添加数据。
③调用Config对象的属性配置数据图。
④调用数据图对象的render_to_xxx()方法将数据图渲染到指定的输出节点一此处的输出节点可以是PNG图片、SVG文件,Ml可以是其他节点。
代码如下:
import pygal

x_data = ['2011', '2012', '2013', '2014', '2015', '2016', '2017']
# 定义2个列表分别作为两组柱状图的Y轴数据
y_data = [58000, 60200, 63000, 71000, 84000, 90500, 107000]
y_data2 = [52000, 54200, 51500,58300, 56800, 59500, 62700]
# 创建pygal.Bar对象(柱状图)
bar = pygal.Bar()
# 添加两组代表条柱的数据
bar.add('疯狂Java讲义', y_data)
bar.add('疯狂Android讲义', y_data2)
## 设置X轴的刻度值
#bar.x_labels = x_data
#bar.title = '疯狂图书的历年销量'
## 设置X、Y轴的标题
#bar.x_title = '年份'
#bar.y_title = '销量'
# 指定将数据图输出到SVG文件中
bar.render_to_file('fk_books.svg')
3. 配置Pygal数据图(柱状图(pygal.Bar()))
pygal.Bar()类来表示柱状图
设置X轴的刻度值:bar.x_labels
标题:bar.title
设置X轴的刻度值旋转X度:bar.x_label_rotatio = X°
设置将图例放在底部:bar.legend_at_bottom = True
设置数据图四周的页边距:bar.margin = 30
隐藏X(Y)轴上的网格线:bar.show_x_guides=False
代码如下:
import pygal

x_data = ['2011', '2012', '2013', '2014', '2015', '2016', '2017']
# 定义2个列表分别作为两组柱状图的Y轴数据
y_data = [58000, 60200, 63000, 71000, 84000, 90500, 107000]
y_data2 = [52000, 54200, 51500,58300, 56800, 59500, 62700]
# 创建pygal.Bar对象(柱状图)
bar = pygal.Bar()
# 添加两组代表条柱的数据
bar.add('疯狂Java讲义', y_data)
bar.add('疯狂Android讲义', y_data2)
# 设置X轴的刻度值
bar.x_labels = x_data
bar.title = '疯狂图书的历年销量'
# 设置X、Y轴的标题
bar.x_title = '年份'
bar.y_title = '销量'
# 设置X轴的刻度值旋转45度
bar.x_label_rotation = 45
# 设置将图例放在底部
bar.legend_at_bottom = True
# 设置数据图四周的页边距
# 也可通过margin_bottom、margin_left、margin_right、margin_top只设置单独一边的页边距
bar.margin = 35
# 隐藏X轴上的网格线
bar.show_y_guides=False
# 显示X轴上的网格线
bar.show_x_guides=True
# 指定将数据图输出到SVG文件中
bar.render_to_file('fk_books.svg')
四、Pygal支持的常见数据图
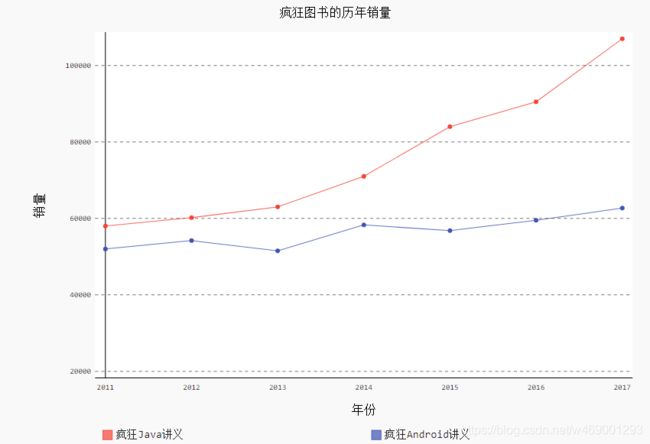
1. 折线图(pygal.Lin())
pygal.Lin类来表示折线图
代码如下:
import pygal

x_data = ['2011', '2012', '2013', '2014', '2015', '2016', '2017']
# 构造数据
y_data = [58000, 60200, 63000, 71000, 84000, 90500, 107000]
y_data2 = [52000, 54200, 51500,58300, 56800, 59500, 62700]
# 创建pygal.Line对象(折线图)
line = pygal.Line()
# 添加两组代表折线的数据
line.add('疯狂Java讲义', y_data)
line.add('疯狂Android讲义', y_data2)
# 设置X轴的刻度值
line.x_labels = x_data
# 重新设置Y轴的刻度值
line.y_labels = [20000, 40000, 60000, 80000, 100000]
line.title = '疯狂图书的历年销量'
# 设置X、Y轴的标题
line.x_title = '年份'
line.y_title = '销量'
# 设置将图例放在底部
line.legend_at_bottom = True
# 指定将数据图输出到SVG文件中
line.render_to_file('fk_books.svg')
2. 水平柱状图和水平折线图(pygal.HorizontalBar())
使用pygal.HorizontalBar类来表示水平柱状图
代码如下:
import pygal

x_data = ['2011', '2012', '2013', '2014', '2015', '2016', '2017']
# 构造数据
y_data = [58000, 60200, 63000, 71000, 84000, 90500, 107000]
y_data2 = [52000, 54200, 51500,58300, 56800, 59500, 62700]
# 创建pygal.HorizontalBar对象(水平柱状图)
horizontal_bar = pygal.HorizontalBar()
# 添加两组数据
horizontal_bar.add('疯狂Java讲义', y_data)
horizontal_bar.add('疯狂Android讲义', y_data2)
# 设置Y轴(确实如此)的刻度值
horizontal_bar.x_labels = x_data
# 重新设置X轴(确实如此)的刻度值
horizontal_bar.y_labels = [20000, 40000, 60000, 80000, 100000]
horizontal_bar.title = '疯狂图书的历年销量'
# 设置X、Y轴的标题
horizontal_bar.x_title = '销量'
horizontal_bar.y_title = '年份'
# 设置将图例放在底部
horizontal_bar.legend_at_bottom = True
# 指定将数据图输出到SVG文件中
horizontal_bar.render_to_file('fk_books1.svg')
3. 叠加柱状图和叠加折线图(pygal.StackedBar())
代码如下:
import pygal

x_data = ['2011', '2012', '2013', '2014', '2015', '2016', '2017']
# 构造数据
y_data = [58000, 60200, 63000, 71000, 84000, 90500, 107000]
y_data2 = [52000, 54200, 51500,58300, 56800, 59500, 62700]
# 创建pygal.StackedBar对象(叠加柱状图)
stacked_bar = pygal.StackedBar()
# 添加两组数据
stacked_bar.add('疯狂Java讲义', y_data)
stacked_bar.add('疯狂Android讲义', y_data2)
# 设置X轴的刻度值
stacked_bar.x_labels = x_data
# 重新设置Y轴的刻度值
stacked_bar.y_labels = [20000, 40000, 60000, 80000, 100000]
stacked_bar.title = '疯狂图书的历年销量'
# 设置X、Y轴的标题
stacked_bar.x_title = '销量'
stacked_bar.y_title = '年份'
# 设置将图例放在底部
stacked_bar.legend_at_bottom = True
# 指定将数据图输出到SVG文件中
stacked_bar.render_to_file('fk_books.svg')
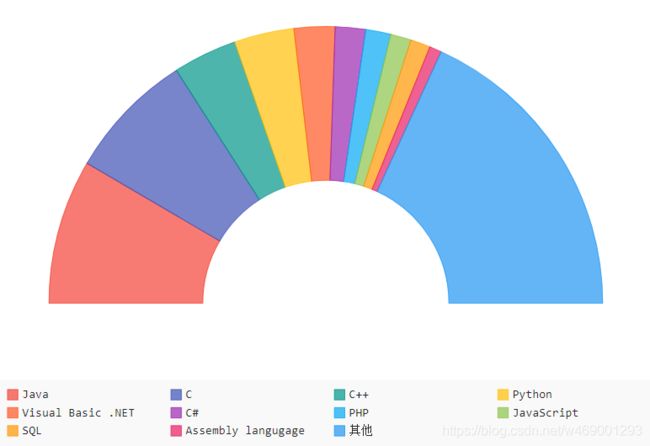
4. 饼图(pygal.Pie)
inner_radius:设置饼图内圈的半径。通过设置该属性可实现环形数据图。
half_pie:将该属性设置为True,可实现半圆的饼图。
代码如下:
import pygal

# 准备数据
data = [0.16881, 0.14966, 0.07471, 0.06992,
    0.04762, 0.03541, 0.02925, 0.02411, 0.02316, 0.01409, 0.36326]
# 准备标签
labels = ['Java', 'C', 'C++', 'Python',
    'Visual Basic .NET', 'C#', 'PHP', 'JavaScript',
    'SQL', 'Assembly langugage', '其他']
# 创建pygal.Pie对象(饼图)
pie = pygal.Pie()
# 采用循环为饼图添加数据
for i, per in enumerate(data):
    pie.add(labels[i], per)
pie.title = '2018年8月编程语言'
# 设置将图例放在底部
pie.legend_at_bottom = True
# 设置内圈的半径长度
pie.inner_radius = 0.4
# 创建半圆数据图
pie.half_pie = True
# 指定将数据图输出到SVG文件中
pie.render_to_file('language_percent.svg')
5. 点图(pygal.Dot)
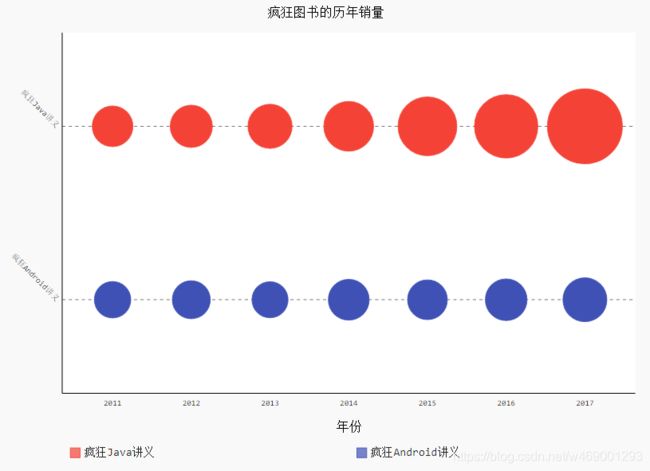
代码如下:
import pygal

x_data = ['2011', '2012', '2013', '2014', '2015', '2016', '2017']
# 构造数据
y_data = [58000, 60200, 63000, 71000, 84000, 90500, 107000]
y_data2 = [52000, 54200, 51500,58300, 56800, 59500, 62700]
# 创建pygal.Dot对象(点图)
dot = pygal.Dot()
dot.dots_size = 5
# 添加两组数据
dot.add('疯狂Java讲义', y_data)
dot.add('疯狂Android讲义', y_data2)
# 设置X轴的刻度值
dot.x_labels = x_data
# 重新设置Y轴的刻度值
dot.y_labels = ['疯狂Java讲义', '疯狂Android讲义']
# 设置Y轴刻度值的旋转角度
dot.y_label_rotation = 45
dot.title = '疯狂图书的历年销量'
# 设置X轴的标题
dot.x_title = '年份'
# 设置将图例放在底部
dot.legend_at_bottom = True
# 指定将数据图输出到SVG文件中
dot.render_to_file('fk_books.svg')
6. 仪表图(pygal.Gauge)
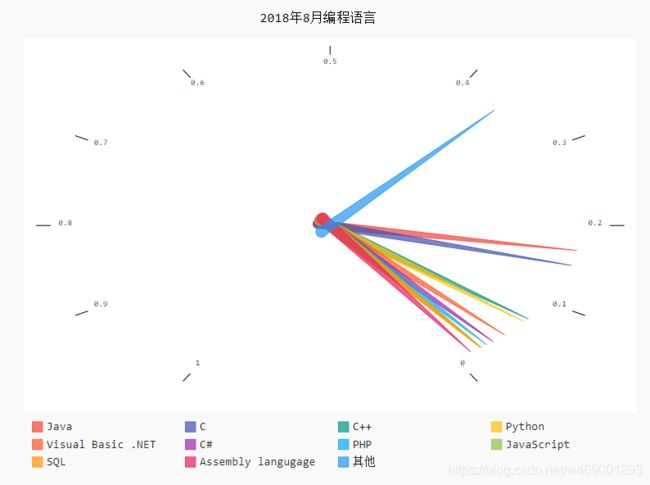
range:该属性用于指定仪表图的最小值和最大值。
代码如下:
import pygal

# 准备数据
data = [0.16881, 0.14966, 0.07471, 0.06992,
    0.04762, 0.03541, 0.02925, 0.02411, 0.02316, 0.01409, 0.36326]
# 准备标签
labels = ['Java', 'C', 'C++', 'Python',
    'Visual Basic .NET', 'C#', 'PHP', 'JavaScript',
    'SQL', 'Assembly langugage', '其他']
# 创建pygal.Gauge对象(仪表图)
gauge = pygal.Gauge()
gauge.range = [0, 1]
# 采用循环为仪表图添加数据
for i, per in enumerate(data):
    gauge.add(labels[i], per)
gauge.title = '2018年8月编程语言'
# 设置将图例放在底部
gauge.legend_at_bottom = True
# 指定将数据图输出到SVG文件中
gauge.render_to_file('language_percent.svg')
7 . 雷达图(pygal.Radar)
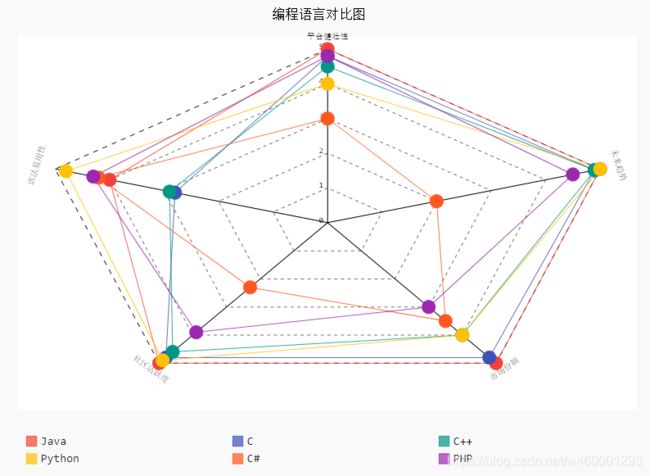
代码如下:
import pygal

# 准备数据
data = [[5, 4.0, 5, 5, 5],
    [4.8, 2.8, 4.8, 4.8, 4.9],
    [4.5, 2.9, 4.6, 4.0, 4.9],
    [4.0, 4.8, 4.9, 4.0, 5],
    [3.0, 4.2, 2.3, 3.5, 2],
    [4.8, 4.3, 3.9, 3.0, 4.5]]
# 准备标签
labels = ['Java', 'C', 'C++', 'Python',
    'C#', 'PHP']
# 创建pygal.Radar对象(雷达图)
rader = pygal.Radar()
# 采用循环为雷达图添加数据
for i, per in enumerate(labels):
    rader.add(labels[i], data[i])
rader.x_labels = ['平台健壮性', '语法易用性', '社区活跃度',
    '市场份额', '未来趋势']
rader.title = '编程语言对比图'
# 控制各数据点的大小
rader.dots_size = 8
# 设置将图例放在底部
rader.legend_at_bottom = True
# 指定将数据图输出到SVG文件中
rader.render_to_file('language_compare.svg')
五、处理数据
1. CSV文件格式
使用csv模块读取CSV文件。
①创建csv模块的读取器。
②循环调用CSV读取器的next()方法逐行读取CSV文件内容即可。next()方法返回一个list列表代表一行数据,list列表的每个元素代表一个单元格数据。
代码如下:
import csv

filename = 'guangzhou-2017.csv'
# 打开文件
with open(filename) as f:
    # 创建cvs文件读取器
    reader = csv.reader(f)
    # 读取第一行,这行是表头数据。
    header_row = next(reader)
    print(header_row)
    # 读取第二行,这行是真正的数据。
    first_row = next(reader)
    print(first_row)
代码如下:
import csv
from datetime import datetime
from matplotlib import pyplot as plt
plt.rcParams['font.sans-serif']=['KaiTi']
plt.rcParams['axes.unicode_minus'] = False

filename = 'guangzhou-2017.csv'
# 打开文件
with open(filename) as f:
    # 创建cvs文件读取器
    reader = csv.reader(f)
    # 读取第一行,这行是表头数据。
    header_row = next(reader)
    print(header_row)
    # 定义读取起始日期
    start_date = datetime(2017, 6, 30)
    # 定义结束日期
    end_date = datetime(2017, 8, 1)
    # 定义3个list列表作为展示的数据
    dates, highs, lows = [], [], []
    for row in reader:
        # 将第一列的值格式化为日期
        d = datetime.strptime(row[0], '%Y-%m-%d')
        # 只展示2017年7月的数据
        if start_date < d < end_date:
            dates.append(d)
            highs.append(int(row[1]))
            lows.append(int(row[2]))

# 配置图形
fig = plt.figure(dpi=128, figsize=(12, 9))
# 绘制最高气温的折线
plt.plot(dates, highs, c='red', label='最高气温',
    alpha=0.5, linewidth = 2.0, linestyle = '-', marker='v')
# 再绘制一条折线
plt.plot(dates, lows, c='blue', label='最低气温',
    alpha=0.5, linewidth = 3.0, linestyle = '-.', marker='o')
# 为两个数据的绘图区域填充颜色
plt.fill_between(dates, highs, lows, facecolor='blue', alpha=0.1)
# 设置标题
plt.title("广州2017年7月最高气温和最低气温")
# 为两条坐标轴设置名称
plt.xlabel("日期")
# 该方法绘制斜着的日期标签
fig.autofmt_xdate()
plt.ylabel("气温(℃)")
# 显示图例
plt.legend()
ax = plt.gca()
# 设置右边坐标轴线的颜色(设置为none表示不显示)
ax.spines['right'].set_color('none')
# 设置顶部坐标轴线的颜色(设置为none表示不显示)
ax.spines['top'].set_color('none')
plt.show()
代码如下:
import csv
import pygal

filename = 'guangzhou-2017.csv'
# 打开文件
with open(filename) as f:
    # 创建cvs文件读取器
    reader = csv.reader(f)
    # 读取第一行,这行是表头数据。
    header_row = next(reader)
    print(header_row)
    # 准备展示的数据
    shades, sunnys, cloudys, rainys = 0, 0, 0, 0
    for row in reader:
        if '阴' in row[3]:
            shades += 1
        elif '晴' in row[3]:
            sunnys += 1
        elif '云' in row[3]:
            cloudys += 1
        elif '雨' in row[3]:
            rainys += 1
        else:
            print(row[3])
# 创建pygal.Pie对象(饼图)
pie = pygal.Pie()
# 为饼图添加数据
pie.add("阴", shades)
pie.add("晴", sunnys)
pie.add("多云", cloudys)
pie.add("雨", rainys)
pie.title = '2017年广州天气汇总'
# 设置将图例放在底部
pie.legend_at_bottom = True
# 指定将数据图输出到SVG文件中
pie.render_to_file('guangzhou_weather.svg')
2. JSON数据
世界各国历年GDP总和,数据来源于https://datahub.io网站。数据格式如下:
[{"Country Code": "ARB", "Country Name": "Arab World",
"Value": 25760683041.0857, "Year": 1968},
{"Country Code": "ARB", "Country Name": "Arab World",
"Value": 28434203615.4829, "Year": 1969},
···
上面的JSON格式数据被保存在方括号内,这些数据将会被转换为Python的list列表,而list列表的每个元素将会是一个dict对象。
使用Python的json模块读取JSON数据非常简单,只要使用load。函数加载JSON数据即可。下面程序示范了读取2016年中国的GDP值。
代码如下:
import json

filename = 'gdp_json.json'

with open(filename) as f:
    gpd_list = json.load(f)
# 遍历列表的每个元素,每个元素是一个GDP数据项
for gpd_dict in gpd_list:
    # 只显示中国、2016年的GDP
    if gpd_dict['Year'] == 2016 and gpd_dict['Country Code'] == 'CHN':
        print(gpd_dict['Country Name'], gpd_dict['Value'])
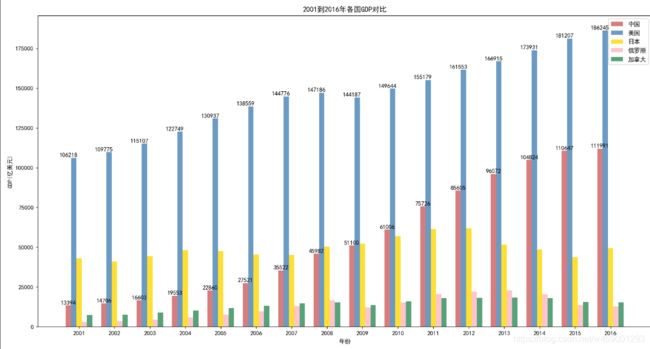
读取从2001年到2016年中国、美国、日本、俄罗斯、加拿大这5个国家的GDP数据,并使用柱状图进行对比。
代码如下:
import json
import matplotlib.pyplot as plt
import numpy as np
# 用来正常显示中文标签,SimHei是字体名称,字体必须再系统中存在,字体的查看方式和安装第三部分
plt.rcParams['font.sans-serif']=['SimHei']
 # 用来正常显示负号
plt.rcParams['axes.unicode_minus']=False


filename = 'gdp_json.json'
# 读取JSON格式的GDP数据
with open(filename) as f:
    gpd_list = json.load(f)
# 使用list列表依次保存中国、美国、日本、俄罗斯、加拿大的GDP值
country_gdps = [{}, {}, {}, {}, {}]
country_codes = ['CHN', 'USA', 'JPN', 'RUS', 'CAN']
# 遍历列表的每个元素,每个元素是一个GDP数据项
for gpd_dict in gpd_list:
    for i, country_code in enumerate(country_codes):
        # 只读取指定国家的数据
        if gpd_dict['Country Code'] == country_code:
            year = gpd_dict['Year']
            # 只读取2001年到2016
            if 2017 > year > 2000:
                country_gdps[i][year] = gpd_dict['Value']
# 使用list列表依次保存中国、美国、日本、俄罗斯、加拿大的GDP值
country_gdp_list = [[], [], [], [], []]
# 构建时间数据
x_data = range(2001, 2017)
for i in range(len(country_gdp_list)):
    for year in x_data:
        # 除以1e8,让数值变成以亿为单位
        country_gdp_list[i].append(country_gdps[i][year] / 1e8)
bar_width=0.15
fig = plt.figure(dpi=128, figsize=(15, 8))
colors = ['indianred', 'steelblue', 'gold', 'lightpink', 'seagreen']
# 定义国家名称列表
countries = ['中国', '美国', '日本', '俄罗斯', '加拿大']
# 采用循环绘制5组柱状图
for i in range(len(colors)):
    # 使用自定义X坐标将数据分开
    plt.bar(x=np.arange(len(x_data))+bar_width*i, height=country_gdp_list[i],
        label=countries[i], color=colors[i], alpha=0.8, width=bar_width)
    # 仅为中国、美国的条柱上绘制GDP数值
    if i < 2:
        for x, y in enumerate(country_gdp_list[i]):
            plt.text(x, y + 100, '%.0f' % y, ha='center', va='bottom')
# 为X轴设置刻度值
plt.xticks(np.arange(len(x_data))+bar_width*2, x_data)
# 设置标题
plt.title("2001到2016年各国GDP对比")
# 为两条坐标轴设置名称
plt.xlabel("年份")
plt.ylabel("GDP(亿美元)")
# 显示图例
plt.legend()
plt.show()
通过 https://datahub.io 网站下载了世界各国人口数据,就可以计算出以上各国的人均GDP。下面程序会使用Pygal来展示世界各国的人均GDP数据。
代码如下:
import json
import pygal

filename = 'gdp_json.json'
# 读取JSON格式的GDP数据
with open(filename) as f:
    gpd_list = json.load(f)
pop_filename = 'population-figures-by-country.json'
# 读取JSON格式的人口数据
with open(pop_filename) as f:
    pop_list = json.load(f)

# 使用list列表依次保存美国、日本、俄罗斯、加拿大的人均GDP值
country_mean_gdps = [{}, {}, {}, {}]
country_codes = ['USA', 'JPN', 'RUS', 'CAN']
# 遍历列表的每个元素,每个元素是一个GDP数据项
for gpd_dict in gpd_list:
    for i, country_code in enumerate(country_codes):
        # 只读取指定国家的数据
        if gpd_dict['Country Code'] == country_code:
            year = gpd_dict['Year']
            # 只读取2001年到2016
            if 2017 > year > 2000:
                for pop_dict in pop_list:
                    # 获取指定国家的人口数据
                    if pop_dict['Country_Code'] == country_code:
                        # 使用该国GDP总值除以人口数量,得到人均GDP
                        country_mean_gdps[i][year] = round(gpd_dict['Value']
                            / pop_dict['Population_in_%d' % year])
# 使用list列表依次保存美国、日本、俄罗斯、加拿大的人均GDP值
country_mean_gdp_list = [[], [], [], []]
# 构建时间数据
x_data = range(2001, 2017)
for i in range(len(country_mean_gdp_list)):
    for year in x_data:
        country_mean_gdp_list[i].append(country_mean_gdps[i][year])
# 定义国家名称列表
countries = ['美国', '日本', '俄罗斯', '加拿大']
# 创建pygal.Bar对象(柱状图)
bar = pygal.Bar()
# 采用循环添加代表条柱的数据
for i in range(len(countries)):
    bar.add(countries[i], country_mean_gdp_list[i])
bar.width=1100
# 设置X轴的刻度值
bar.x_labels = x_data
bar.title = '2001到2016年各国人均GDP对比'
# 设置X、Y轴的标题
bar.x_title = '年份'
bar.y_title = '人均GDP(美元)'
# 设置X轴的刻度值旋转45度
bar.x_label_rotation = 45
# 设置将图例放在底部
bar.legend_at_bottom = True
# 指定将数据图输出到SVG文件中
bar.render_to_file('mean_gdp.svg')
3. 数据清洗
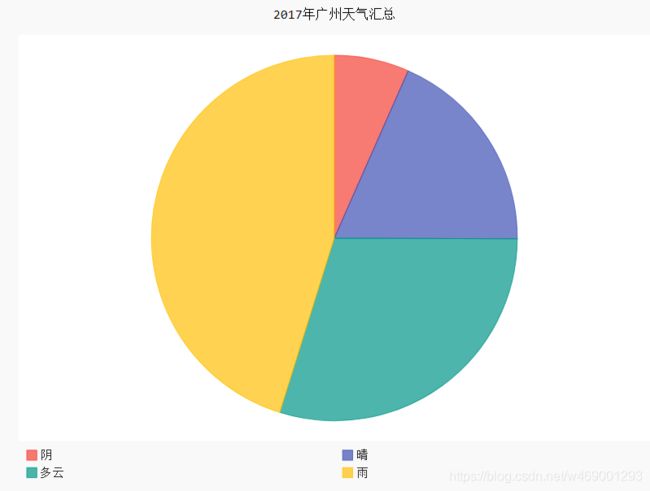
如果仔细査看前面介绍的展示2017年广州天气情况的程序,不难发现最终只统计出363天天气情况(雨天:164天;晴天:67天;阴天:24天;多云天:108天),但一年应该有365天,因此这份数据出现了问题。
当程序使用Python进行数据展示时,经常发现数据存在以下两种情况。
- 数据丢失。
- 数据格式错误。
对于数据丢失的情况,程序应该生成报告;对于数据格式发生错误的情况,程序应该能略过发生错误的数据,继续处理后面的程序,并报告发生错误的数据。
代码改进,如下:
import csv
import pygal
from datetime import datetime
from datetime import timedelta

filename = 'guangzhou-2017.csv'
# 打开文件
with open(filename) as f:
    # 创建cvs文件读取器
    reader = csv.reader(f)
    # 读取第一行,这行是表头数据。
    header_row = next(reader)
    print(header_row)

    # 准备展示的数据
    shades, sunnys, cloudys, rainys = 0, 0, 0, 0
    prev_day = datetime(2016, 12, 31)
    for row in reader:
        try:
            # 将第一列的值格式化为日期
            cur_day = datetime.strptime(row[0], '%Y-%m-%d')
            description = row[3]
        except ValueError:
            print(cur_day, '数据出现错误')
        else:
            # 计算前、后两天数据的时间差
            diff = cur_day - prev_day
            # 如果前、后两天数据的时间差不是相差一天,说明数据有问题
            if diff != timedelta(days=1):
                print('%s之前少了%d天的数据' % (cur_day, diff.days - 1))
            prev_day = cur_day
            if '阴' in description:
                shades += 1
            elif '晴' in description:
                sunnys += 1
            elif '云' in description:
                cloudys += 1
            elif '雨' in description:
                rainys += 1
            else:
                print(description)
# 创建pygal.Pie对象(饼图)
pie = pygal.Pie()
# 为饼图添加数据
pie.add("阴", shades)
pie.add("晴", sunnys)
pie.add("多云", cloudys)
pie.add("雨", rainys)
pie.title = '2017年广州天气汇总'
# 设置将图例放在底部
pie.legend_at_bottom = True
# 指定将数据图输出到SVG文件中
pie.render_to_file('guangzhou_weather.svg')

>>> ['Date', 'Max TemperatureC', 'Min TemperatureC', 'Description', 'WindDir', 'WindForce']
>>> 2017-03-06 00:00:00之前少了2天的数据
4. 读取网络数据
前面己经介绍了 Python的网络支持库:urllib,通过该库下的request模块可以非常方便地向远程发送HTTP请求,获取服务器响应。因此,本程序的思路是使用urllib.request向lishi.tianqi.com发送请求,获取该网站的响应,然后使用Python的re模块来解析服务器响应,从中提取天气数据。
本程序将会通过网络读取http://lishi.tianqi.com站点的数据,并展示2017年广州的最高气温和最低气温。
代码如下:
import re
from datetime import datetime
from datetime import timedelta
from matplotlib import pyplot as plt
from urllib.request import *

# 定义一个函数读取lishi.tianqi.com的数据
def get_html(city, year, month):  #①
    url = 'http://lishi.tianqi.com/' + city + '/' + str(year) + str(month) + '.html'
    # 创建请求
    request = Request(url)
    # 添加请求头
    request.add_header('User-Agent', 'Mozilla/5.0 (Windows NT 10.0; WOW64)' +
        'AppleWebKit/537.36 (KHTML, like Gecko) Chrome/54.0.2840.99 Safari/537.36')
    response = urlopen(request)
    # 获取服务器响应
    return response.read().decode('gbk')

# 定义3个list列表作为展示的数据
dates, highs, lows = [], [], []
city = 'guangzhou'
year = '2017'
months = ['01', '02', '03', '04', '05', '06', '07',
    '08', '09', '10', '11', '12']
prev_day = datetime(2016, 12, 31)
# 循环读取每个月的天气数据
for month in months:
    html = get_html(city, year, month)
    # 将html响应拼起来
    text = "".join(html.split())
    # 定义包含天气信息的div的正则表达式
patten = re.compile('(.*?) - (.*?)
这个程序后半部分的绘图代码与前面程序并没有太大的区别,该程序的最大改变在于前半部分代码,该程序不再使用csv模块来读取本地CSV文件的内容。
该程序使用urllib.request来读取lishi.tianqi.com站点的天气数据,程序中①号代码定义了一个get_html()函数来读取指定站点的HTML内容。
接下来程序使用循环依次读取01-12每个月的响应页面,程序读取到每个响应页面的HTML内容,这份HTML页面内容中包含天气信息的源代码如图19.37所示。
程序中第一行粗体字代码使用正则表达式来获取包含全部天气信息的<div…/>元素,即图19.37中数字1所标识的<div…/>元素。
程序中第二行粗体字代码使用正则表达式来匹配天气<div…/>中没有属性的<ul…/>元素,即图19.37中数字2所标识的<ul…/>元素。这样的3…/>元素有很多个,每个<ul…/>元素代表一天的天气信息,因此,上面程序使用了循环来遍历每个元素。
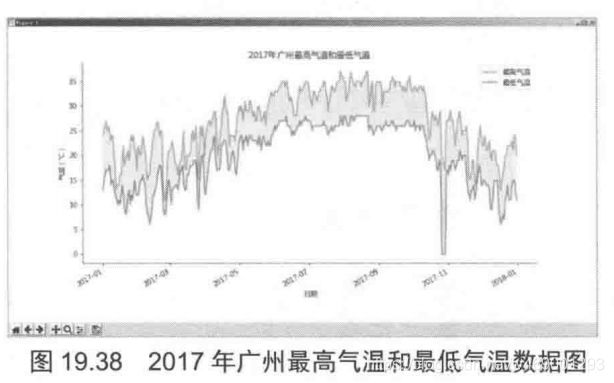
程序中第三行粗体字代码使用正则表达式来匹配每日天气<uL…/>中的<li…/>元素,即图19.37中数字3所标识的<li…/>元素。在每个<ul…/>元素内可匹配到6个<li…/>元素,但程序只获取日期、最高气温和最低气温,因此,程序只使用前三个<li…/>元素的数据。
通过网络、正则表达式获取了数据之后,程序使用Matplotlib来展示它们。运行上面程序,可以看到如图19.38所示的数据图。

