有害评论识别问题:数据可视化与频率词云
机器学习训练营——机器学习爱好者的自由交流空间(入群联系qq:2279055353)
案例介绍
一项由谷歌发起的研究,使用机器学习技术识别在线谈话里的有害评论。这里的“有害评论”,是指任何粗鲁的(rude)、无礼的(disrespectful), 或者其它导致某人终止讨论的言谈。该案例将构建分类模型,识别有害评论,并且减少不需要的偏差。例如,一个特定的名字经常与有害评论联系,一些模型可能把出现在无害评论里的同名的评论错误地分在有害评论里。
数据描述
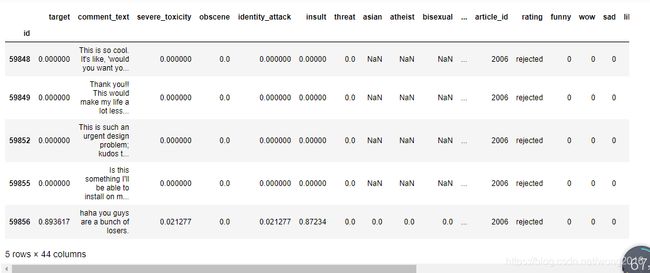
在案例数据集里,每一条评论文本在comment_text列。训练集的每一条评论有一个toxicity标签(target), 开发的模型将预测检验集里的target. 所有其它属性是给定评论的属性比例值。为了便于评价模型,在检验集里,target>0.5的样本被标记为阳性类(toxic).
加载包
import gc
import os
import warnings
import operator
import numpy as np
import pandas as pd
import seaborn as sns
import matplotlib.pyplot as plt
from tqdm import tqdm_notebook
from wordcloud import WordCloud, STOPWORDS
import gensim
from gensim.utils import simple_preprocess
from gensim.parsing.preprocessing import STOPWORDS
from nltk.stem import WordNetLemmatizer, SnowballStemmer
from nltk.stem.porter import *
import nltk
from gensim import corpora, models
import pyLDAvis
import pyLDAvis.gensim
from keras.preprocessing.text import Tokenizer

pyLDAvis.enable_notebook()
np.random.seed(2018)
warnings.filterwarnings('ignore')
加载数据
JIGSAW_PATH = "../input/jigsaw-unintended-bias-in-toxicity-classification/"
train = pd.read_csv(os.path.join(JIGSAW_PATH,'train.csv'), index_col='id')
test = pd.read_csv(os.path.join(JIGSAW_PATH,'test.csv'), index_col='id')
显示train, test的前5行。
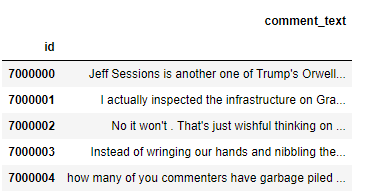
train.head(), test.head()
数据探索
评论文本存储在comment_text列里。此外,在train里有标记特定的敏感主题是否存在于评论里。主题与5个类别有关:
-
race or ethnicity: asian, black, jewish, latino, other_race_or_ethnicity, white
-
gender: female, male, transgender, other_gender
-
sexual orientation: bisexual, heterosexual, homosexual_gay_or_lesbian, other_sexual_orientation
-
religion: atheist,buddhist, christian, hindu, muslim, other_religion
-
disability: intellectual_or_learning_disability, other_disability, physical_disability, psychiatric_or_mental_illness
我们也有几个评论识别信息:
-
created_date
-
publication_id
-
parent_id
-
article_id
几个评论相关的用户反馈信息:
-
rating
-
funny
-
wow
-
sad
-
likes
-
disagree
-
sexual_explicit
数据集里还有两个注释变量:
-
identity_annotator_count
-
toxicity_annotator_count
目标特征
让我们检查一下训练集里target值的分布。
plt.figure(figsize=(12,6))
plt.title("Distribution of target in the train set")
sns.distplot(train['target'],kde=True,hist=False, bins=120, label='target')
plt.legend(); plt.show()
def plot_features_distribution(features, title):
    plt.figure(figsize=(12,6))
    plt.title(title)
    for feature in features:
        sns.distplot(train.loc[~train[feature].isnull(),feature],kde=True,hist=False, bins=120, label=feature)
    plt.xlabel('')
    plt.legend()
    plt.show()
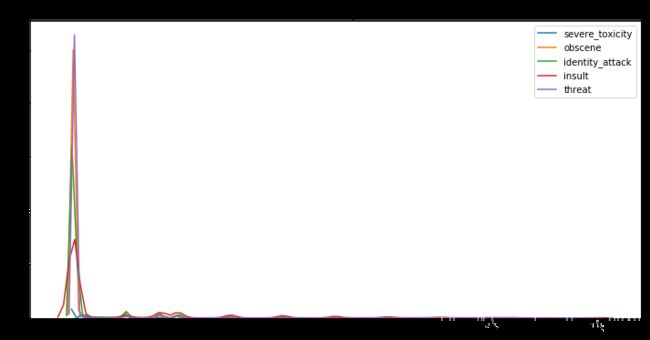
features = ['severe_toxicity', 'obscene','identity_attack','insult','threat']
plot_features_distribution(features, "Distribution of additional toxicity features in the train set")
敏感的话题
现在,让我们检查敏感话题特征的值分布。
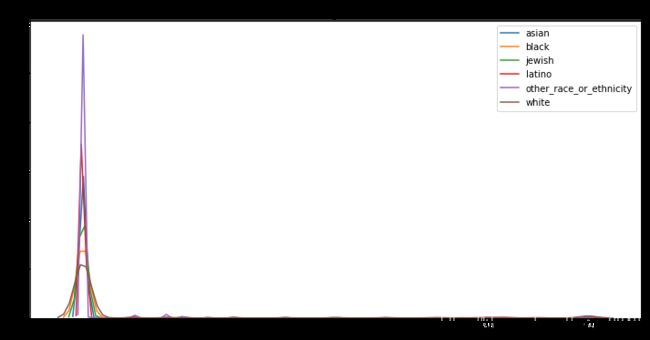
features = ['asian', 'black', 'jewish', 'latino', 'other_race_or_ethnicity', 'white']
plot_features_distribution(features, "Distribution of race and ethnicity features values in the train set")
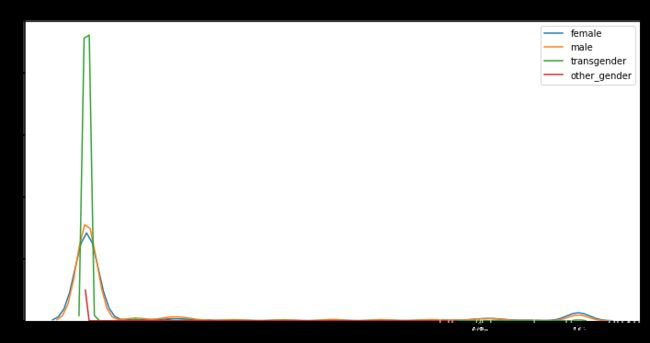
features = ['female', 'male', 'transgender', 'other_gender']
plot_features_distribution(features, "Distribution of gender features values in the train set")
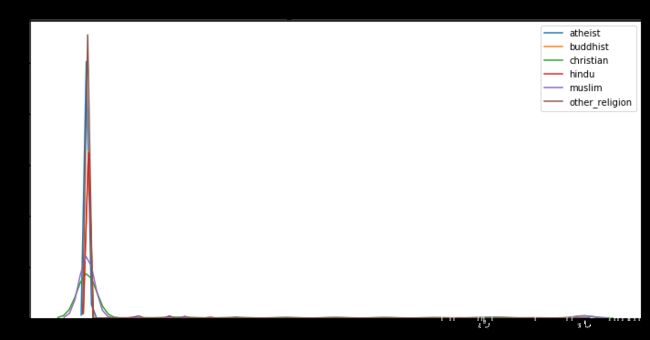
features = ['atheist','buddhist',  'christian', 'hindu', 'muslim', 'other_religion']
plot_features_distribution(features, "Distribution of religion features values in the train set")
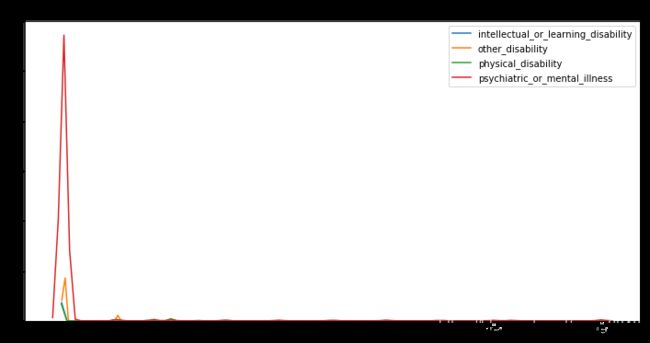
features = ['intellectual_or_learning_disability', 'other_disability', 'physical_disability', 'psychiatric_or_mental_illness']
plot_features_distribution(features, "Distribution of disability features values in the train set")
反馈信息
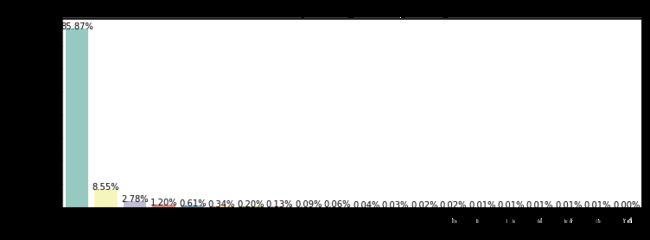
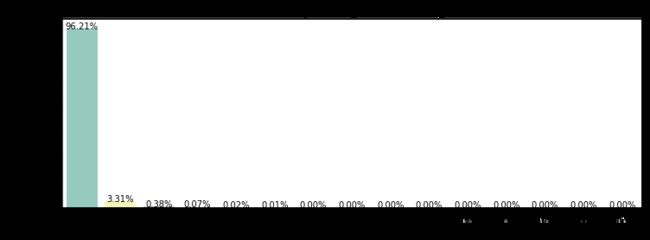
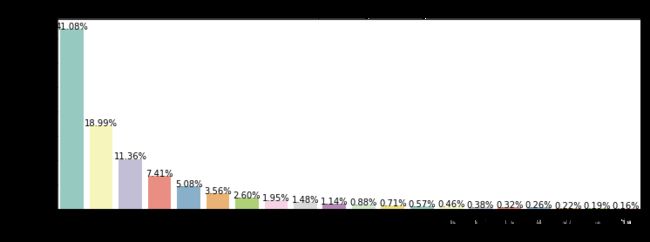
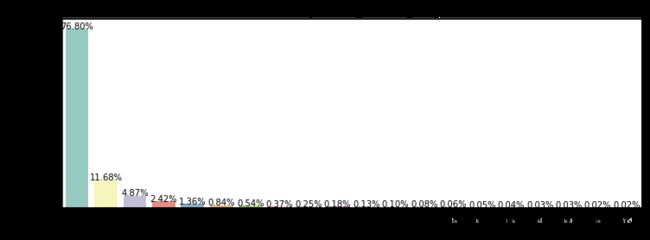
让我们看一看反馈信息值的分布。
def plot_count(feature, title,size=1):
    f, ax = plt.subplots(1,1, figsize=(4*size,4))
    total = float(len(train))
    g = sns.countplot(train[feature], order = train[feature].value_counts().index[:20], palette='Set3')
    g.set_title("Number and percentage of {}".format(title))
    for p in ax.patches:
        height = p.get_height()
        ax.text(p.get_x()+p.get_width()/2.,
                height + 3,
                '{:1.2f}%'.format(100*height/total),
                ha="center")
    plt.show()
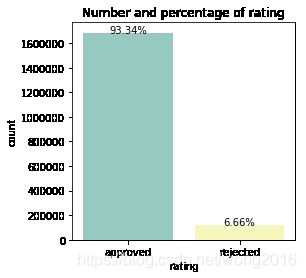
plot_count('rating','rating')
plot_count('funny','funny votes given',3)
plot_count('wow','wow votes given',3)
plot_count('sad','sad votes given',3)
plot_count('likes','likes given',3)
plot_count('disagree','disagree given',3)
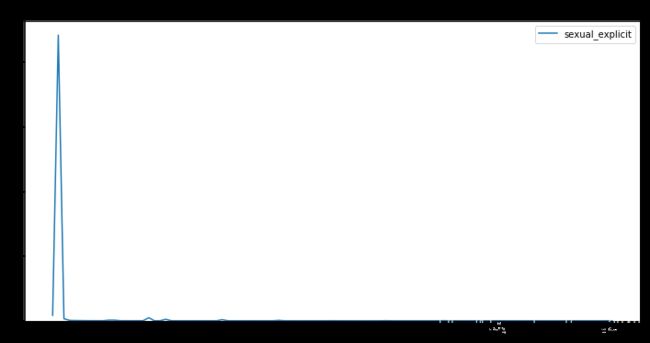
features = ['sexual_explicit']
plot_features_distribution(features, "Distribution of sexual explicit values in the train set")
评论词云
让我们看一看评论所使用的的词的频率排在前50位的词云。
stopwords = set(STOPWORDS)

def show_wordcloud(data, title = None):
    wordcloud = WordCloud(
        background_color='white',
        stopwords=stopwords,
        max_words=50,
        max_font_size=40,
        scale=5,
        random_state=1
    ).generate(str(data))

    fig = plt.figure(1, figsize=(10,10))
    plt.axis('off')
    if title:
        fig.suptitle(title, fontsize=20)
        fig.subplots_adjust(top=2.3)

    plt.imshow(wordcloud)
    plt.show()
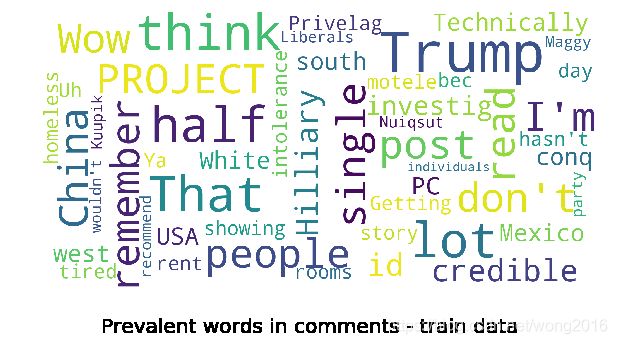
我们看一看训练集里的流行词。
show_wordcloud(train['comment_text'].sample(20000), title = 'Prevalent words in comments - train data')
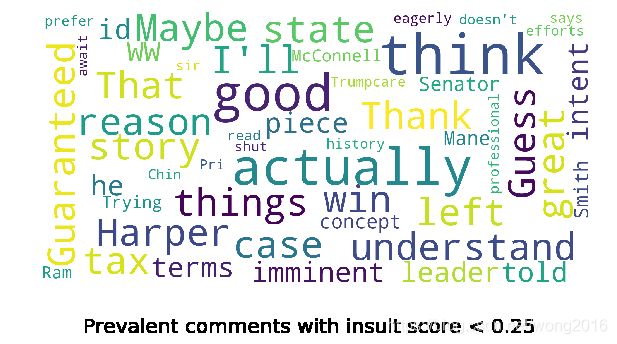
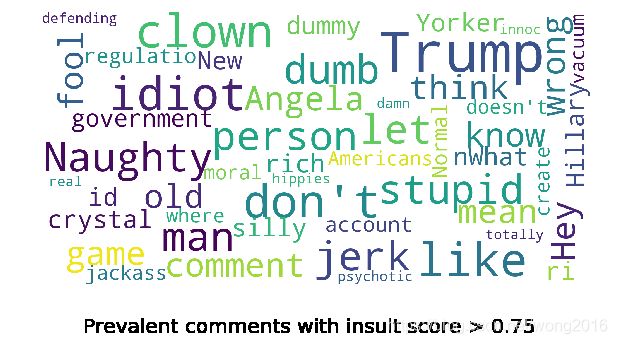
我们看一看insult score在0.25 以下,0.75 以上的词的使用频率。
show_wordcloud(train.loc[train['insult'] < 0.25]['comment_text'].sample(20000),
               title = 'Prevalent comments with insult score < 0.25')
show_wordcloud(train.loc[train['insult'] > 0.75]['comment_text'].sample(20000),
               title = 'Prevalent comments with insult score > 0.75')
类似的,也可以做threat score, obscene score, target (toxicity) score相关词云。
更多精彩内容请关注微信公众号“统计学习与大数据”
