Kalman Filter 相关文章
文章目录
- 绪论
- Self-driving car object tracking: Intuition and the math behind Kalman Filter
- 曲线相乘
- overlapping belief and measurements
- Bayes filter terms
- Input controls
- process noise
- covariance matrix Q
- C矩阵
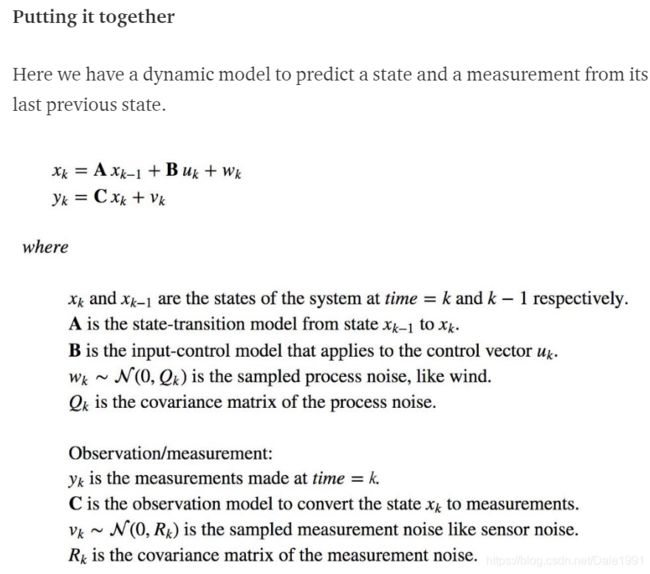
- 动态模型
- y hat
- y bar
- K 增益
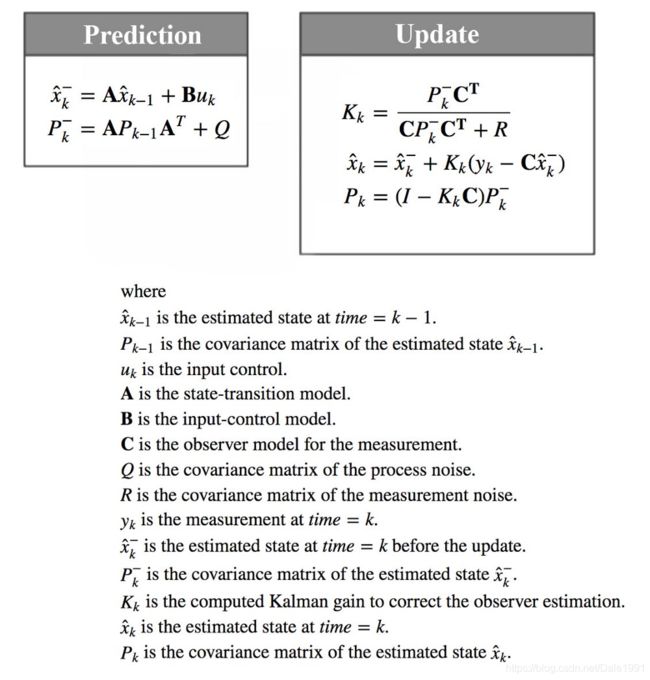
- 一般化:prediction
- 一般化:update
- 与曲线乘法的区别
- 总结
- 传感器数据融合
- 引用
- Extended Kalman Filter simplified— Udacity’s Self-driving Car Nanodegree
- 项目的目的
- 什么是KF算法
- Kalman Filter Cycle
- 也是乘法
- Prediction
- “mean” state vector
- Laser Measurements
- Laser -公式
- Z 矩阵
- H 矩阵
- What is Extended Kalman Filters?
- Nonlinear function(Radar measurement)
- First Order Taylor Expansion
- The main differences are:
- drawbacks
- Radar Measurements
- 引用
- Self-driving car: Tracking cars with Extended and Unscented Kalman Filter
- 引用
- Others
绪论
下面这三篇文章感觉写的很好,现将重点难点摘录出来。
Self-driving car object tracking: Intuition and the math behind Kalman Filter
Three major components of autonomous driving are localization (where am I), perception (what is around me), and control (how to drive around). We are dealing with sensors to perceive what is around us. Those sensors offer many benefits but yet suffer some significant drawback. Cameras offer high resolution but cannot detect speed and distance easily. LiDAR creates a nice 3-D map. But LiDAR is huge and expensive. Also, both camera and LiDAR are vulnerable to bad weather and environmental factors. RADAR works better in bad conditions and detects speed well. But its resolution is not high enough for precise maneuver. When we are dealing with self-driving car sensors, we do not have a one-size-fits-all solution. Kalman filter is designed to fuse sensor readings to make more accurate predictions than each individual sensor alone. However, the math in Kalman filter can be un-necessary overwhelming. We will cover the intuition first followed by explanations on the math to make it easier.
曲线相乘
- To recalibrate our location, we take a GPS measurement. But remember, the measurement is noisy so we use a stochastic model to describe it also.
?这个测量的噪声参数如何获得? - 左边的是我们认为的(belief),右边的是GPS测量得到的。
- The red curve below indicates the probabilities of finding the car at different locations.
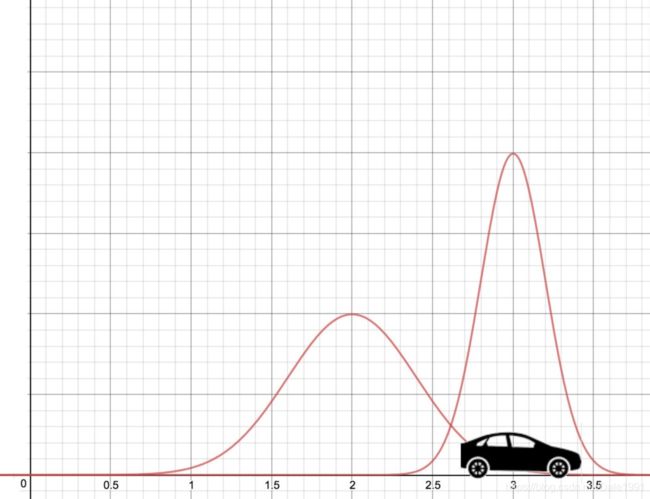
如果将左右两幅图中的曲线(a probability distribution function PDF)乘起来,然后做 renormalizing 处理,使得从负无穷到正无穷积分为1,则可以得到下面的瘦曲线。 - a probability distribution function PDF 有误,应该是probability density function
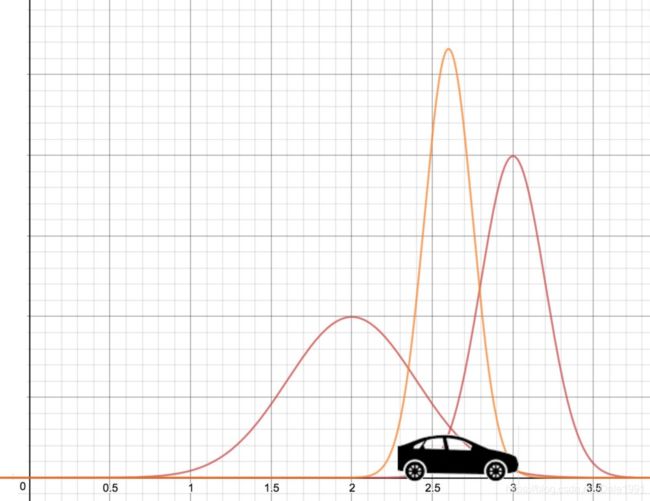
- It has a peak at 2.6m where both red curves agree the most. 此处为真实值的概率最大。
- 更瘦高(sharper):意味着we are more certain about the location now.
- In particular, multiple probability curves are computationally intense. We need a more efficient approach to merge probability curves.
- We can also view this approach as a weighted sum between the belief and the measurements.带有权重的融合过程。
overlapping belief and measurements
How can we get a more accurate result with two less accurate information?
- 现实生活中,测量仪器有误差,但是误差的概率密度曲线(a probability distribution function PDF)是很精确的。比如,许多仪器的测量误差是服从方差可被仪器确定的高斯分布的,因此,我们可以准确的求导出概率曲线。?如何计算仪器的误差高斯分布?
- 通过上面的相乘计算,我们可以定位共同的预测位置,提高最后预测的准确性。

Bayes filter terms
- When Kalman filter is explained as a Bayes filter, the belief is also called prior and the final prediction is called posterior.
- 我们首先有一次服从高斯分布的GPS的读数,我们可以使用这个初始的读数去构建一个PDF,并作为我们的belief。程序中是如何体现这个belief的
- 然后使用动态模型去预测汽车的下一个位置
- 最简单的方式就是 下一个位置=当前位置 + 速度*间隔时间
- 然后我们用GPS观测一下并作出PDF图。
- 我们将这两个PDF图融合成一个PDF,final prediction
- 当卡尔曼滤波被解释成一个贝叶斯滤波器的话,那么我们的belief 就是先验概率,final prediction就是后验概率。
Input controls
process noise
- We use process noise w to represent random factors that are difficult to model precisely, for example, the wind effect and the road condition.

- We assume w is Gaussian distributed with a zero mean and covariance matrix Q.
covariance matrix Q
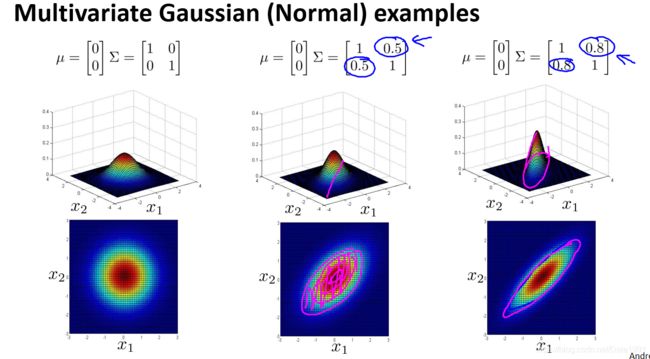
- 方差是用来描述一维高斯分布(R.V.偏离期望值的程度)的,而协方差矩阵是用来描述多维高斯分布的。Variance is for 1-D Gaussian distribution while covariance matrix is for n-D Gaussian distribution) ?协方差矩阵的物理意义是什么?
1 state vector上每个维度都会对应有一个高斯分布的干扰误差,本例中比如 速度 位置
2 这些不同维度上的高斯干扰可能会存在相关性。

C矩阵
- 通常,我们可以直接测量 y k y_k yk,也就是汽车的位置,这时候C就是单位矩阵。
- 有些情况,我们无法直接测量状态向量中的值,需要一个C矩阵将测量值和状态向量中的值进行转化。(坐标系相同,仍然是笛卡尔坐标系)
- 矩阵做坐标变化。For example, the state of a RADAR is stored in polar coordinates. We use C to convert it to Cartesian.代码中如何体现
动态模型
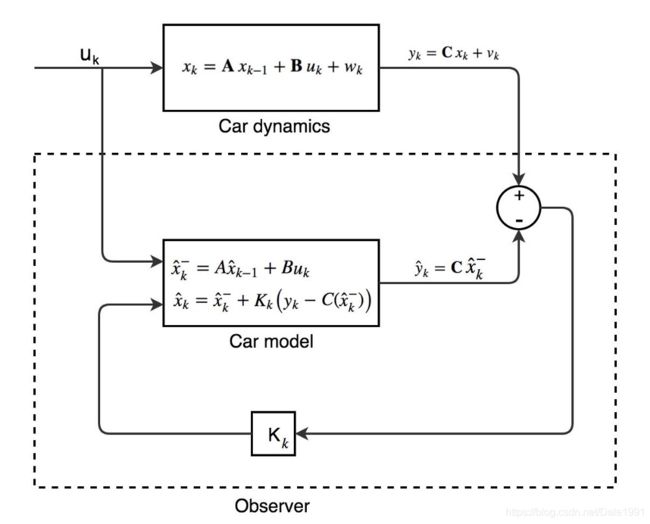
y hat
- Symbols with a hat, like ŷ, mean values estimated in the observer world.
y bar
- To reduce confusion, we introduce the notation with a minus sign to indicate the estimated state before the update. Now our car model becomes:

K 增益
利用K增益,将观测值估计的偏差映射到状态估计的偏差处。
- 利用协方差矩阵计算final prediction的时候可以推导出此式(徐亦达 动态模型)
- 新的预测值就是旧的预测值+偏差值。
- 总之,我们使用我们估计的测量值和实际测试的差去做一个对下一个状态值的预测的修正。

- K是如何计算的?
- 当C为单位矩阵,R=0,即没有测量干扰(相当于测量永远准确),则,每次状态向量的更新全都依赖于测量值。预测的作用将无效?

一般化:prediction
- Back to linear algebra, if we apply a transformation matrix A to an input x with a covariance matrix ∑, the covariance matrix of the output (Ax) is simply:

- Putting the process noise back, the Gaussian model for the estimated state before the update is
- ?协方差矩阵相加? 因为状态向量和process noise 之间是相互独立的,因此和的方差就等于方差的和 D ( X + Y ) = D ( X ) + D ( Y ) + 2 E ( [ X − E ( Y ) ] [ Y − E ( Y ) ] ) D(X+Y)=D(X)+D(Y)+2E{([X-E(Y)][Y-E(Y)])} D(X+Y)=D(X)+D(Y)+2E([X−E(Y)][Y−E(Y)])
- 注意下面右图PDF曲线变“矮胖”,说明方差变大(协方差矩阵),估计值的不确定性增加。

一般化:update
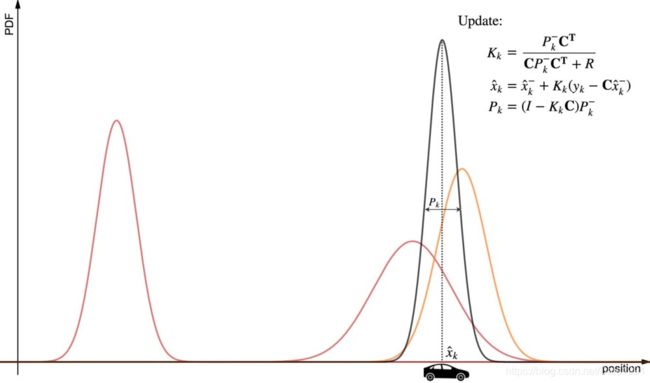
- Since the estimated state (before the update) and the measurement are Gaussian distributed, the final estimated state is also Gaussian distributed.
- 我们可以通过线性代数的运算,去计算最终的高斯模型。
- ?是否应该先有一个对 y k y_k yk的观察测量?
- 计算K增益
- 由预测的协方差矩阵推导出updata的协方差矩阵
- 由预测的状态向量、K增益、观测值和预测值的偏差推导出updata的状态向量
与曲线乘法的区别
- Comparing with our previous explanation, we do not multiple curves together. Kalman Filter uses simple linear algebra and is much simpler.
总结
传感器数据融合
- 激光雷达利用快速的激光束构建一个3维的环境模型。激光束波长较短,可以以很高的分辨率检测很小的物体。但是天气如果不好,雨天,雾天等,测量噪声就会很大。
- 雷达的波长更长一些,应对天气不好的情况更加可靠,但是整体的精度较差。
- sensor fusion 可以将不同的测量结果通过KF融合起来。
- 多个传感器的测量误差之间是不相关的,因此we can apply Kalman filter one at a time for each measurement to refine the prediction.
引用
Self-driving car object tracking: Intuition and the math behind Kalman Filter
Extended Kalman Filter simplified— Udacity’s Self-driving Car Nanodegree
can use a Kalman filter in any place where we have uncertain information about some dynamic system, and It can make an educated guess about what the system is going to do next. Is it interesting?
项目的目的
- The goal of the project is to write Kalman filter and Extended kalman filter algorithms for accurately tracking bicycle’s position and velocity.
什么是KF算法
- KF是一种使用不可靠测量,或者是不可直接测量的数据去估计、预测系统的状态向量的值。
- 一个卡尔曼滤波器仅仅使用在线性系统中。如果你有一个非线性系统,而且想去估计系统的状态,你需要使用一个非线性系统的estimator
Kalman Filter Cycle
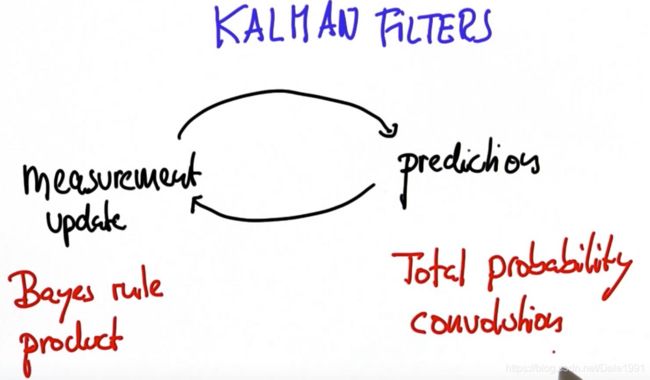
- The Kalman filter represents our distributions by Gaussians and iterates on two main cycles: Prediction and Measurement update. 这是什么?
也是乘法
- Kalman filter says optimal way to estimate the position is combining these two results. This is done by multiplying these two probability functions together and the result will also be another gaussian function.

Prediction
“mean” state vector
-
It is called the “mean” state vector because position and velocity are represented by a gaussian distribution with mean x.
-
F is the Transition Matrix (the one that deals with time steps and constant velocities) 也就是说,这个矩阵是说明系统是线性系统,也只能处理匀速的情况,?所以说,加速度只能作为干扰放到后面Q中?
Laser Measurements
只能获取位置信息,不能获取速度信息。但是精度很高
Laser -公式
-
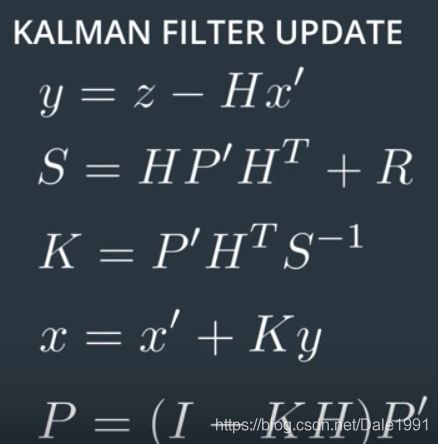
y y y:测量值和系统预测的测量值的差
-
S S S:预测经过非线性变换之后的方差
-
K K K:增益,
-
x = x ′ + K . y x=x'+K.y x=x′+K.y: K值在这里 用于衡量测量值重要还是观测值重要。
Z 矩阵
- Z:对于激光雷达来说,只包含了追踪物体在笛卡尔坐标系上位置的横纵坐标。
H 矩阵
- H is the matrix that projects your belief about the object’s current state into the measurement space of the sensor.
- For lidar, this is a fancy way of saying that we discard velocity information from the state variable since the lidar sensor only measures position。
What is Extended Kalman Filters?
- goes further and allows us to get the velocity information as well.
Nonlinear function(Radar measurement)
- Our predicated state x is represented by gaussian distribution which is mapped to Nonlinear function(Radar measurement), then resulting function will not be a gaussian function.
- 因此卡尔曼滤波器就不再试用了,考虑到其只工作在高斯函数中

First Order Taylor Expansion
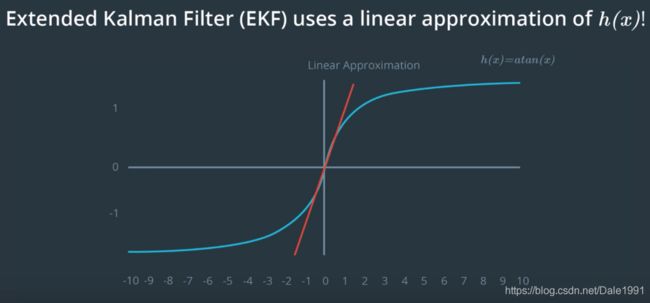
EKF uses a method called First Order Taylor Expansion to linearise the function.
The main differences are:
- The F matrix will be replaced by Fj when calculating P′.
- The H matrix in the Kalman filter will be replaced by the Jacobian matrix Hj when calculating S, K, and P.
- To calculate x′, the prediction update function, f, is used instead of the F matrix.
- To calculate y, the h function is used instead of the H matrix.
float rho = sqrt(px*px + py*py); # 这些就是h function。不是通过矩阵转化的,而是函数
float theta = atan2(py, px);
float rho_dot = (px*vx + py*vy) / rho;
//Finding h(x)的值向量
VectorXd h = VectorXd(3); // h(x_)
h << rho, theta, rho_dot;
VectorXd y = z-h;
//New estimate
x_ = x_ + (K * y); // 通过这一步,可将三维的y 变回成4维的x, 从而保证循环的正常
drawbacks
- 雅克比行列式很难计算
- EKF 只能工作在 system 是一个 differentiable model(可微分的模型).
Radar Measurements
- 因为Radar 测量模型是一个非线性系统,所以在测量更新阶段,我们需要使用EKF算法计算。但在预测阶段,我们仍可以使用和(KF)前面一致的模型。
- H 矩阵和 H(x) 事实上做的事情相同,都需要计算出估算预测值和实际测量值之间的偏差:y=z−Hx′
- 但是对于Radar测量的数据,需要手动计算,将state vector x 转到极坐标系下,然后和Radar测量数据做差
- so φ from the ?video clip above? in that situation would actually be negative.

引用
Extended Kalman Filter simplified— Udacity’s Self-driving Car Nanodegree
Self-driving car: Tracking cars with Extended and Unscented Kalman Filter
引用
Self-driving car: Tracking cars with Extended and Unscented Kalman Filter
-
原来的动态模型中,A B C都是矩阵。所以如果初始化状态向量是高斯分布,则最后的预测的状态向量也是高斯分布,所以卡尔曼滤波算法运作良好
-
但是很多 dynamic models are non-linear. The model will be written as:

-
如果模型中的状态转移矩阵 or 测量矩阵不是线性函数,则即使初始化状态向量仍然是高斯分布,但是最后的输出不再是高斯分布了
-
However, if we limit the range of x, the function f can be approximated by a linear function.
-
If the function f is close to a linear function or f is close to linear for our target range of x, we can use Extended Kalman Filter to replace Kalman Filter.
-
如何近似,怎样算近似?
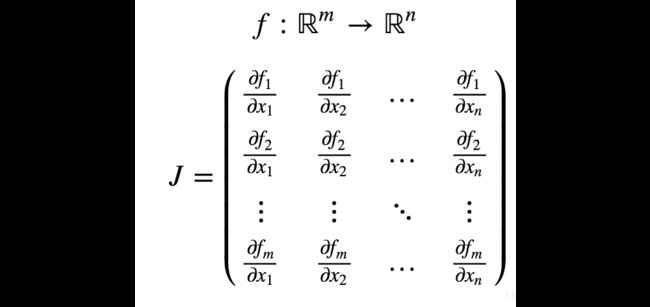
- 为啥?f1 f2 分别指的是什么?
答: x 1 , x 2 . . . x n x_1,x_2...x_n x1,x2...xn 代表的是状态向量中的n个维度。
Others
kalman滤波(一)—对各参数的理解
自动驾驶中的传感器融合算法:第一部分-卡尔曼滤波器和扩展卡尔曼滤波器
卡尔曼滤波原理快速理解 https://blog.csdn.net/weixin_39449570/article/details/78846690


