5 Robotics: Estimation and Learning 第1+2周 代码详解+卡尔曼滤波预测笔记(GMM预测+卡尔曼滤波预测)
5 Robotics: Estimation and Learning GMM预测+卡尔曼滤波预测
- WEEK 1
- Programming Assignment: Color Learning and Target Detection
- WEEK 2
- Kalman Filter Tracking
首先这个系列的第一个单元是空中机器人,第二单元运动规划,第三单元感知(相机方面)
以下博客如下:
1 Robotics: Aerial Robotics 第1+2周 课程学习记录及课后习题解答
1 Robotics: Aerial Robotics 第3+4周 课程学习记录及课后习题解答
2 Robotics: Computational Motion Planning 第1周(内含Dijkstra 和 A* MATLAB代码手把手教学)课后习题解答
2 Robotics: Computational Motion Planning 第2+3+4周 课后习题解答
3 Robotics: Mobility 课程学习记录及课后习题解答
4 Robotics: Perception 课程学习记录及课后习题解答
此课程在Coursera需要科学上网才能观看,放一下B站和Coursera的课程链接
- UP主 博主自己做的字幕版本 这个单元会全部更新完(持续更新)
- Coursera的链接介绍
此文仅为听课记录以及做题思考,有所错误的地方或是好的想法欢迎评论区交流。(点个赞就更好了,鼓励一下~)
- 3.5:听完第一周,我觉得这个单元是这个系列里的最好了吧,第二是运动规划(主要是作业非常引人深思),第三是空中机器人;后面过程中,我讲吧,这周主要是高斯模型和GMM,一起预测小球位置什么的,具体可以看我翻译上传的,(这周超爽只有编程作业,哈哈哈哈哈哈),第一周很有意思,有几个点可能会不知道怎么办,那么开始了。写完啦~ 下一周慢慢来~ 这周编程over了
- 3.6:这卡尔曼滤波十分有意思,但是这个系列的课程讲的真的不是很好,建议如果想真的明白一点,走讨论区的链接(贼仔细)Youtube Michel van Biezen The Kalman Filter(不想看视频/看不了的可以直接看我笔记,我觉得我记得十分详细… ),当然编程题目还是要做的啦,那么开始啦
WEEK 1
Programming Assignment: Color Learning and Target Detection
这一切的前提,麻烦点击b站视频先看完这周的视频,我相信你会对GMM有个完整的了解同时用EM方法计算等,接下来就开始作业了。
作业的pdf其实说的清楚顺序,但是有些详细的没说清,
1.打开example_rgb.m然后,这里不是说你运行,标完点就over了(要训练多边形),后面是要写个高斯的,计算 μ \mu μ和 σ \sigma σ的
这里如果已经运行完,计算方差的时候可能会报错:
MTIMES (*) 不完全支持整数类。至少一个参数必须为标量。

出错 cov (line 155)
c = (xc' * xc) ./ denom;

出错 example_rgb (line 57)
    sigma(i) = cov(Samples(:,i));
这是因为你的Samples是unit8的,所以这个有两种解决方法:1.不用RGB来作为高斯的训练,而是另一种HSV(H色调,S饱和度,V明度),因为这个是double类型,而且和RGB一样,也是3个,3维训练的。2.如果你好不容易已经标完了多边形,有了RGB的样本点了,那么还有另一种方法就是!强制转换double(Sample(:,1))即可。具体代码如下:(添加在example_rgb.m后面运行部分即可)
%%%%%%%%%%%%%%%%%%%%%%%%%%%%%%%%%%%%%%%%%
% [IMPORTANT]
%
% Now choose you model type and estimate the parameters (mu and Sigma) from
% the sample data.
%%
D=3; %确定维度
mu=zeros(1,D);
sigma=zeros(1,D);
for i=1:D
    mu(i)=mean(Samples(:,i));
    sigma(i)=cov(double(Samples(:,i)));
end
mu%显示一下mu
sigma%显示一下sigma
这里我们需要记录mu和sigma的值也就是显示出来的:
mu =

  148.4140  144.0171   62.4389


sigma =

  208.4049  133.1187  375.4475
这个有什么用呢?emm 如果你不知道 那证明你得回去看视频课(反正能1.5倍速快速回顾一下吧) -> 没错 初始化!(接下来是一个个讲的如果觉得废话了,可以跳转到完整代码区哈~)
第一部分代码如下:
%%%%%%%%%%%%%%%%%%%%%%%%%%%%%%%%%%%%%%%%%%
% Hard code your learned model parameters here
%
mu = [148.4140  144.0171   62.4389];
sigma = [208.4049  133.1187  375.4475];
thre =  0.2e-5;
然后大家可能会问了:初始化了mu和sigma还有个thre你没初始化,为什么有值呀?
那个嘛… 一开始我也不知道啥 随便给了个0.0000001然后去讨论区,助教的一句话点醒了
特此复制过来:
b. To set threshold you have to visualize your probability matrix (probability of all pixels in image based on your model) .Use surf or histogram for visualizing it and then example_test.m to see how your parameters are doing. 完整链接跳转 点击此处
也就是说如果要设置阈值,你先得看看你的可能性函数长啥样
那么:让我们开始吧,第二部分代码如下:
%%%%%%%%%%%%%%%%%%%%%%%%%%%%%%%%%%%%%%%%%%
% Find ball-color pixels using your model
%
[mrows,mcols,D]=size(I);
mask = zeros(mrows,mcols);
prob_den=[];
for i=1:mrows
    for j=1:mcols
        prob_den(i,j)=mvnpdf(double([I(i,j,1),I(i,j,2),I(i,j,3)]),mu,sigma);
        if prob_den(i,j)>thre
            mask(i,j)=1;
        end
    end
end
figure,surf(prob_den);
很多人可能问了,mvnpdf是啥?emm 你看看我写的啥,是不是有点像求那个点的高斯函数值?是的!大家help一下就能看明白了,特此把MATLAB的说明也复制过来吧:
y = mvnpdf(X,mu,sigma) returns pdf values of points in X, where sigma determines the covariance of each associated multivariate normal distribution.
Specify [] for mu to use its default value of zero when you want to specify only sigma.
最后的figure,surf(prob_den)就是我画可能性的图了,那么图开始了:
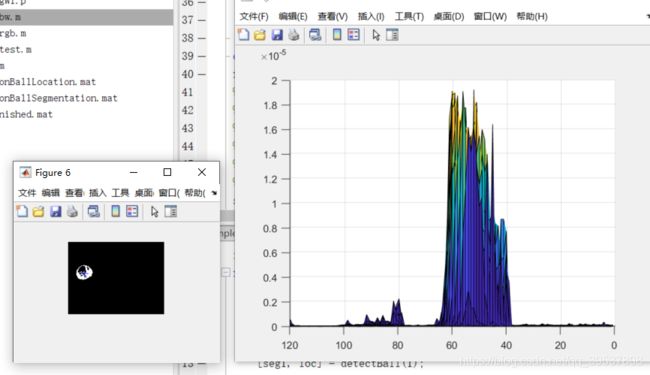
这里能看到什么?看到了,emm 大概给个0.2*10-5球的位置差不多能被划分,
接下来我们看看其他球照片:

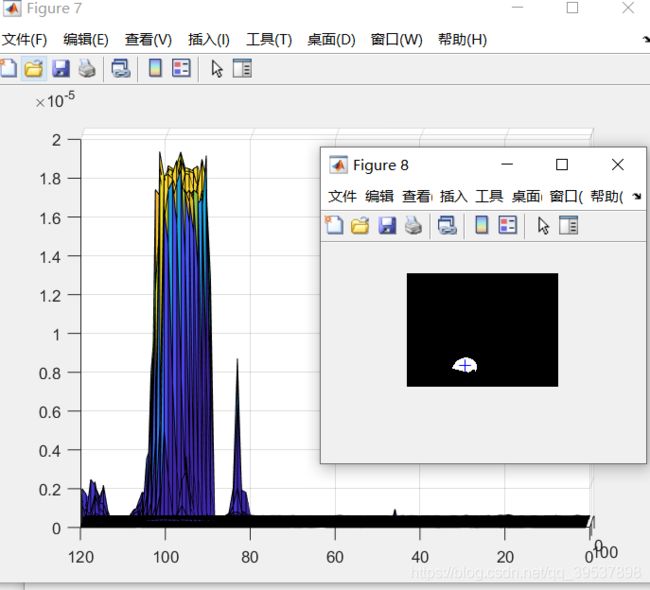
第三张照片可能更突然一点,也就是0.2似乎小了,应该放到0.8比较好,其实… 不太好,因为就这一个一点点有,所以,以此确定咱们的thre=0.2e-5(这个是MATLAB的科学计数法哈)
完成初始化和第二部分基本就over了,因为后面是输出数的格式而已,文档也说了,请参考example_bw进行改写即可。
所以这个编程作业的主要难点在:1.初始化!很多人不知道怎么去看mu,sigma,thre怎么初始化的,2.两个for循环那段可能不太清楚怎么写(其实应该清楚,只是需要一个指引罢了)
那么我就贴 完整代码(在这里) detectBall.m:
% Robotics: Estimation and Learning
% WEEK 1
%
% Complete this function following the instruction.
function [segI, loc] = detectBall(I)
% function [segI, loc] = detectBall(I)
%
% INPUT
% I       120x160x3 numerial array
%
% OUTPUT
% segI    120x160 numeric array
% loc     1x2 or 2x1 numeric array

%%%%%%%%%%%%%%%%%%%%%%%%%%%%%%%%%%%%%%%%%%
% Hard code your learned model parameters here
%
mu = [148.4140  144.0171   62.4389];
sigma = [208.4049  133.1187  375.4475];
thre =  0.2e-5;


%%%%%%%%%%%%%%%%%%%%%%%%%%%%%%%%%%%%%%%%%%
% Find ball-color pixels using your model
%
[mrows,mcols,D]=size(I);
mask = zeros(mrows,mcols);
prob_den=[];
for i=1:mrows
    for j=1:mcols
        prob_den(i,j)=mvnpdf(double([I(i,j,1),I(i,j,2),I(i,j,3)]),mu,sigma);
        if prob_den(i,j)>thre
            mask(i,j)=1;
        end
    end
end
figure,surf(prob_den);
%%%%%%%%%%%%%%%%%%%%%%%%%%%%%%%%%%%%%%%%%%
% Do more processing to segment out the right cluster of pixels.
% You may use the following functions.
%   bwconncomp
%   regionprops
% Please see example_bw.m if you need an example code.
segI=false(mrows,mcols);
CC=bwconncomp(mask);
numPixels = cellfun(@numel,CC.PixelIdxList);
[biggest,idx] = max(numPixels);
%%%%%%%%%%%%%%%%%%%%%%%%%%%%%%%%%%%%%%%%%%
% Compute the location of the ball center
%

segI(CC.PixelIdxList{idx}) = true;
S = regionprops(CC,'Centroid');
loc = S(idx).Centroid;
%
% Note: In this assigment, the center of the segmented ball area will be considered for grading.
% (You don't need to consider the whole ball shape if the ball is occluded.)
end
虽然我的这个可能后面划分也有点问题,但是整个划分的范围还是对的,所以提交也得了满分~ 有其他想法的也可以一起交流,顺便点个赞,谢谢各位。
WEEK 2
Kalman Filter Tracking
emm 还是那句话 最好先看视频(尽管这个系列讲的不好,但是有个人讲的很好呀 -> Youtube Michel van Biezen The Kalman Filter)
放听课笔记

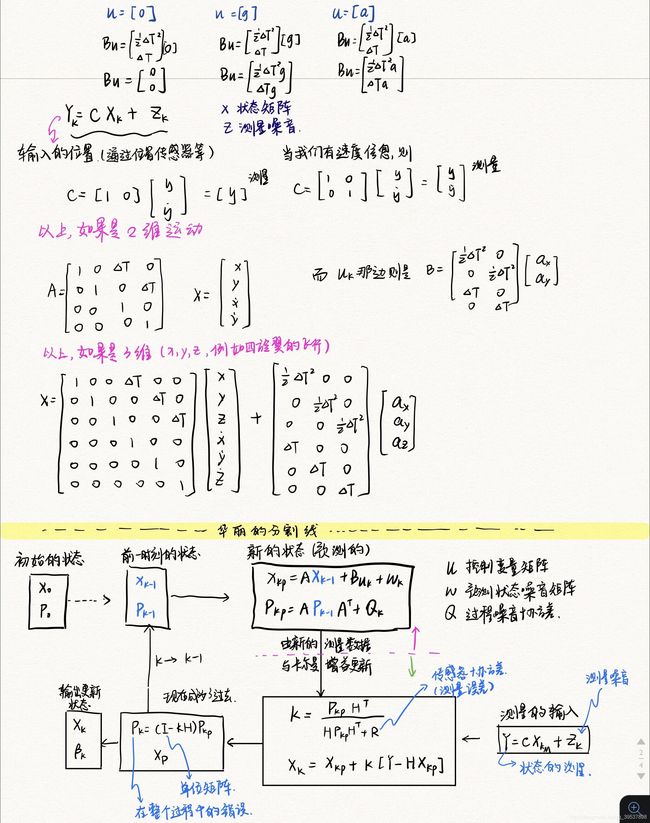
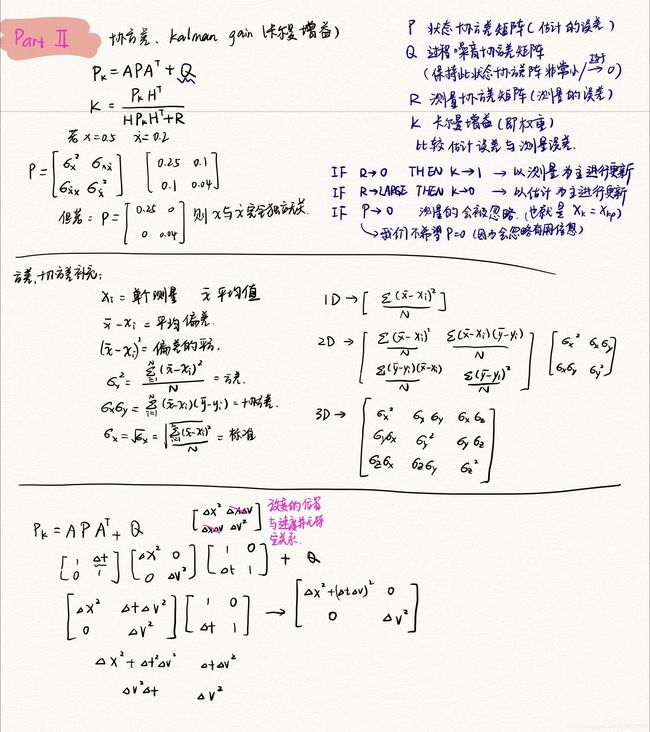
emm 为什么后面都没记了呢,因为后面… 都在举那个上升气球的数值例子… 都是数字了,那么,不知道你们这么看能不能看懂哎… 希望大家都能看懂吧…(不枉费我对着看了一下午的视频)
首先,说一下笔记中的C和H是一样的,具体为什么,我看了很多人的解释说是:为了把卡尔曼的增益矩阵形式变成与H/C一样的… emm,大概就是这么个意思。
那么接下来?nonono 不是代码,是讨论区的题目TIPS:WEEK 2 讨论区
Part 1. Multi-dimensional Kalman Filter in general case.
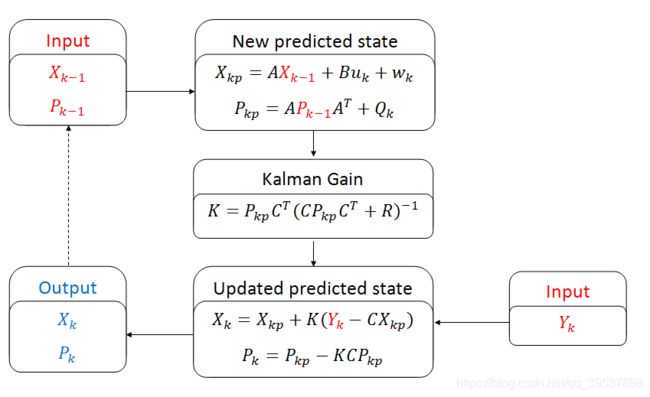
这里面的字母意思如下:(和我上面的笔记可能字母有点不一样,正好也再理解理解吧~)
- X is state (for ex., 4x1 vector: {x ;y; vx ;vy} )
- P is state covariance matrix (for ex., 4x4 matrix)
- A is transition matrix for velocity term (for ex., 4x4 matrix)
- B is transition matrix for acceleration term (for ex., 4x2 matrix)
- u is acceleration matrix (for ex., 2x1 matrix)
- w is matrix representing noise in the process (for ex., 4x1 matrix)
- Q is system noise covariance matrix (for ex., 4x4 matrix)
- K is Kalman Gain (for ex., 4x2 matrix)
- C is observation matrix (for ex. 2x4 matrix)
- R is measurement noise covaiance matrix (for ex., 2x2 matrix)
- Y is measurement matrix (for ex., 2x1 matrix: {z_x; z_y})
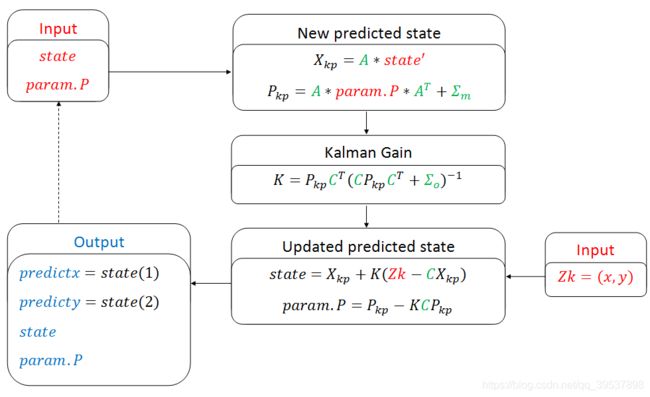
Part 2. Multi-dimensional Kalman Filter for this assignment case.
Part 3. Code skeleton.
这里是代码骨架,没有答案的哦,可以先自己尝试一下,用上面的知识和这个框架先写一写
function [ predictx, predicty, state, param ] = kalmanFilter( t, x, y, state, param, previous_t )
%UNTITLED Summary of this function goes here
%   Four dimensional state: position_x, position_y, velocity_x, velocity_y

    %% Place parameters like covarainces, etc. here:
    dt = 0.033;

      % Noise covariance matrices
    Sigma_m =
    Sigma_o =

      % Transition matrix
    A =

    % Observation matrix
    C =

    % Check if the first time running this function
    if previous_t<0
        state = [x, y, 0, 0];
        param.P = Sigma_m;
        predictx = x;
        predicty = y;
        return;
    end

    %% TODO: Add Kalman filter updates

    % Predicted state & covariance matrix
    Xkp =
    Pkp =

    % Kalman gain
    K =

    % Z measrement
    Z =

    % Update covariance matrix
    param.P =

    % Update state
    state =

    % Prediction
    predictx = state(1);
    predicty = state(2);

end
emm 说了那么多,终于到答案和注意事项的时候了,其实也不是… 答案,大家各有想法不用唯一化~
1.你问我… 噪音协方差你咋知道的?
emm 我不知道… 但是听视频说,协方差别=0,放个比较小的就行(PS 实际上呢,你得看你传感器的性质而定哈)
2.其他的代码中的,A、C、Xkp、Pkp一系列的都在上面的笔记和讨论区的图里了。
function [ predictx, predicty, state, param ] = kalmanFilter( t, x, y, state, param, previous_t )
%UNTITLED Summary of this function goes here
%   Four dimensional state: position_x, position_y, velocity_x, velocity_y

    %% Place parameters like covarainces, etc. here:
    dt = 0.033;
      % Noise covariance matrices
    Sigma_m = 0.01 * eye(4);
    Sigma_o = 0.01 * eye(2);

      % Transition matrix
    A = [1 0 dt 0;
        0 1 0 dt;
        0 0 1 0;
        0 0 0 1];

    % Observation matrix
    C = [1 0 0 0;
         0 1 0 0];

    % Check if the first time running this function
    if previous_t<0
        state = [x, y, 0, 0];
        param.P = 0.001 * eye(4);
        predictx = x;
        predicty = y;
        return;
    end

    %% TODO: Add Kalman filter updates

    % Predicted state & covariance matrix
    Xkp = A*state';
    Pkp = A*param.P*A'+Sigma_m;
    R=Sigma_o;
    % Kalman gain
    K = Pkp*C'/(C*Pkp*C'+R);

    % Y/Z measrement
    Y = [x y]';

    % Update covariance matrix
    param.P = Pkp-K*C*Pkp;

    % Update state
    state = (Xkp+K*(Y-C*Xkp))';

    % Prediction
    predictx = state(1)+dt * state(3);
    predicty = state(2)+dt * state(4);

end
所以… 现在大家应该没得问题了,PS最后的更新state记得转置(因为下一次你还得按以前格式输进来,不然又报错矩阵维度不一致了,以上,虽然这周的课不行,但是秉承着翻译的初衷,还是都翻译了…
最后,希望大家能真正看懂卡尔曼滤波的预测了(虽然我还是对那个C和H有点迷) 。走的时候留个赞,三连什么的最好了。
C和H那里搞懂了,又看了一遍其他视频的卡尔曼滤波的理解,C和H是一阶偏微分,也就是Jacobians矩阵,看什么时候有时间再开一个帖子专门整理一下这些天看过的卡尔曼滤波预测(这么一数下来,我似乎看了1、2、3、4个讲解视频,1、2个pdf文档,卡尔曼自己写的论文,emm 还拿MATLAB和Python实践了2遍… )