Geotrellis学习笔记(一)——核密度分析
在geotrellis环境下成功运行了helloworld之后,我第一个尝试的核密度计算~整个过程还是挺艰难的。。。因为对scala非常地不熟,基本属于边写边学的状态T^T
嗯。。首先 核密度分析是什么???
官方文档里对核密度分析有一段这样的介绍:
Kernel density is one way to convert a set of points (an instance of vector data) into a raster. In this process, at every point in the point set, the contents of what is effectively a small Tile (called a Kernel) containing a predefined pattern are added to the grid cells surrounding the point in question (i.e., the kernel is centered on the tile cell containing the point and then added to the Tile). This is an example of a local map algebra operation. Assuming that the points were sampled according to a probability density function, and if the kernel is derived from a Gaussian function, this can develop a smooth approximation to the density function that the points were sampled from. (Alternatively, each point can be given a weight, and the kernel values can be scaled by that weight before being applied to the tile, which we will do below.)
——首先,核密度分析是一种将点要素的集合(矢量数据)转换为栅格数据的一种手段。在这个例子里,对于每一个点来说,其实是一块小瓦片(被称为核)
核密度的作用是:“ 使用核函数根据点或折线要素计算每单位面积的量值以将各个点或折线拟合为光滑锥状表面。”
嗷懂了~做核密度分析就好比把离散的点想成一个个的山顶,然后我们要利用这些山顶的位置还原出一个地表面(差不多是这样吧。。)
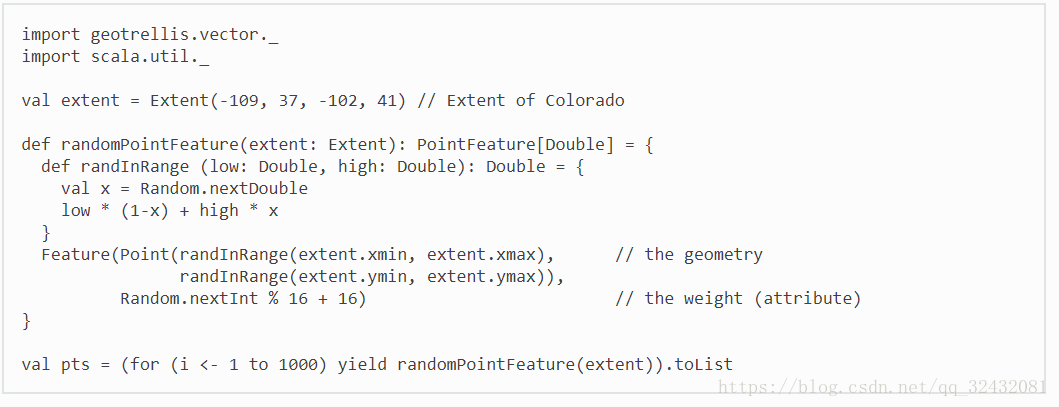
为了进行核密度分析,首先要生成一批点数据:
Scala中的yield的主要作用是记住每次迭代中的有关值,并逐一存入到一个数组中。
scala中的for循环是有返回值的,这里返回的就是 PointFeature[Double]
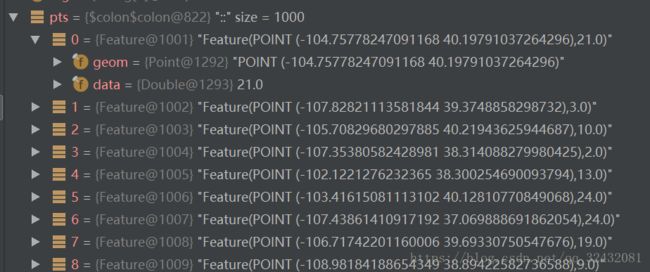
这样就生成了1000个带有权重的点要素,这里权重的范围为(0,32):
然后定义一个高斯核函数,并且用高斯核函数生成tile:
生成的kde结果如下:
array里面记录的就是280000个像素的值,这里的tile应该不是瓦片的意思,就是一张大图
然后把这种图输出:
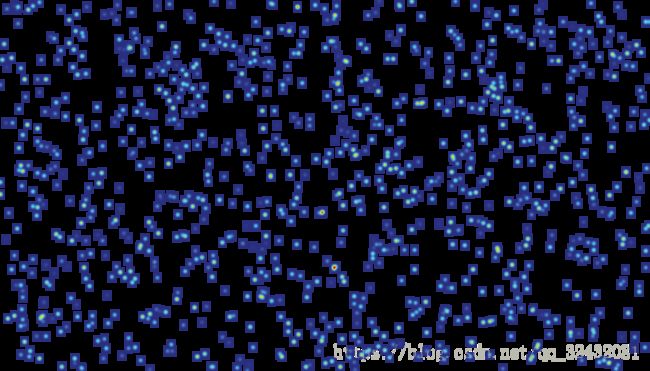
下面这张图就是输出的结果:
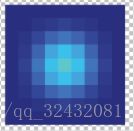
放大来看:
可以看到每一小块的边长都是9,这个边长就是前面的那个kernelWidth。 可以看到这里是一个离散点就对应了一个方块,方块里的值都是中心最高然后慢慢下降的,可以想象,当kernelWidth很大的时候,就会形成一张全覆盖的栅格图像,这就是上面概念里说的“光滑锥状表面”。
然后我们对这张大图进行分割:
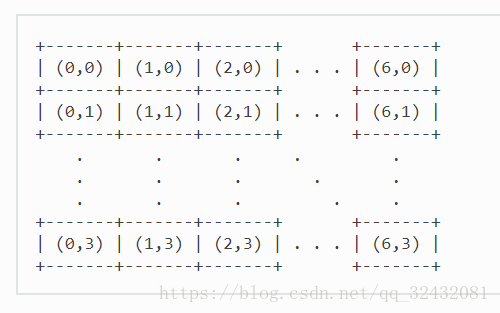
将这张大图切成28块
然后我们可以计算出一个点对应的方块范围是多少:
也就是上图的这个范围。
然后我们考虑为图像编号,编号的方式为:(int,int),即(column,row):
然后我们就可以把所有点赋予一个空间索引,这段代码的作用是计算每一个点对应的空间格网的编号:
假设pts映射到格网的结果是
p1→grid1 p2→grid2 p3→grid2 将结果按照grid的编号进行groupby
groupby之后的结果:
 可以看到1000个点都被映射到了大格网下,我原以为这里大格网的个数是28个,但发现这里index是从0开始的,一共有40个大格网,1000点占了其中的37个
一开始我不是很懂的是为什么产生了8*5个格子,而不是7*4个,后面又是怎么变回7*4个的?
嗯后来知道应该是因为这里计算的是9*9的小格子占的格网数,位于边缘处的点占的格子可能会超出范围
然后,将每一个大格网单独进行核密度分析:
最后:
注意,这里用了until,说明r和c都值遍历0~3 以及0~6,即遍历28遍
getOrElse() 方法: 可以使用 getOrElse() 方法来获取元组中存在的元素或者使用其默认的值
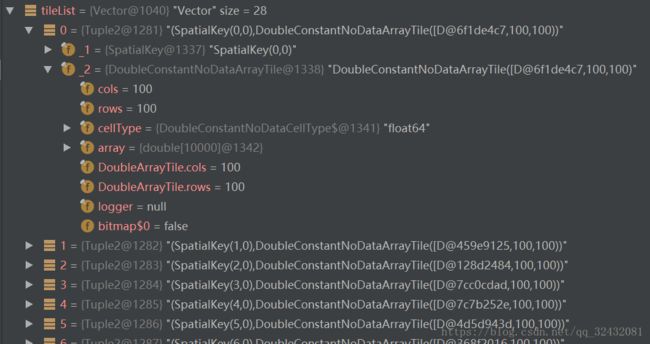
运行结果是28个100*100的瓦片:
代码的最后一句话就是将28张瓦片合在一起:
最后将stitched输出得到和之前同样的结果:
最后贴上完整代码:
import geotrellis.raster._
import geotrellis.raster.io.geotiff.SinglebandGeoTiff
import geotrellis.spark._
import geotrellis.vector._
import scala.util._
import geotrellis.raster.density.KernelStamper
import geotrellis.raster.mapalgebra.local.LocalTileBinaryOp
import geotrellis.raster.mapalgebra.focal.Kernel
import geotrellis.raster.render._
import geotrellis.spark.tiling._
import geotrellis.spark._
import geotrellis.spark.stitch.TileLayoutStitcher


object Main {
  def helloSentence = "Hello GeoTrellis"
  val tl = TileLayout(7, 4, 100, 100)
  val extent = Extent(-109, 37, -102, 41) // Extent of Colorado
  val ld = LayoutDefinition(extent, tl)

  def main(args: Array[String]): Unit = {
//    val geotiff = SinglebandGeoTiff("D:\\IdeaProjects\\ScalaDemo\\data\\pm25.tif")
//    geotiff.tile
//    val a=1
    val pts = (for (i <- 1 to 1000) yield randomPointFeature(extent)).toList
    val kernelWidth: Int = 9
    /* Gaussian kernel with std. deviation 1.5, amplitude 25 */
    val kern: Kernel = Kernel.gaussian(kernelWidth, 1.5, 25)
    val kde: Tile = pts.kernelDensity(kern, RasterExtent(extent, 700, 400))
    val colorMap = ColorMap(
      (0 to kde.findMinMax._2 by 4).toArray,
      ColorRamps.HeatmapBlueToYellowToRedSpectrum
    )
//
//    kde.renderPng(colorMap).write("D:\\IdeaProjects\\ScalaDemo\\data\\test.png")  //如果用tiff的话可以带上坐标系信息

    val keyfeatures: Map[SpatialKey, List[PointFeature[Double]]] =
      pts
        .flatMap(ptfToSpatialKey)
        .groupBy(_._1)
        .map { case (sk, v) => (sk, v.unzip._2) }
    val keytiles = keyfeatures.map { case (sk, pfs) =>
      (sk, pfs.kernelDensity(
        kern,
        RasterExtent(ld.mapTransform(sk), tl.tileDimensions._1, tl.tileDimensions._2)
      ))
    }
    val aa=ld.layoutRows    //4
    val dd = ld.layoutCols  //7
    val bb =tl.tileRows     //100
    val cc =tl.tileCols     //100

    for(i<- 0 until 7){
      println(i)
    }
    val tileList =
      for {
        r <- 0 until ld.layoutRows   //4
        c <- 0 until ld.layoutCols    //7
      } yield {
        val k = SpatialKey(c,r)
        (k, keytiles.getOrElse(k, IntArrayTile.empty(tl.tileCols, tl.tileRows)))
      }

    val stitched = TileLayoutStitcher.stitch(tileList)._1
    stitched.renderPng(colorMap).write("D:\\IdeaProjects\\ScalaDemo\\data\\result.png")
  }

  /**
    * convert the list of points into a collection of (SpatialKey, List[PointFeature[Double]])
    * @param ptf
    * @tparam D
    * @return
    */
  def ptfToSpatialKey[D](ptf: PointFeature[D]): Seq[(SpatialKey,PointFeature[D])] = {
    val ptextent = ptfToExtent(ptf)
    val gridBounds = ld.mapTransform(ptextent)   //gridBounds的格式为:(col,row)

    for {
      (c, r) <- gridBounds.coords
      if r < tl.totalRows
      if c < tl.totalCols
    } yield (SpatialKey(c,r), ptf)
  }

  def ptfToExtent[D](p: PointFeature[D]) = pointFeatureToExtent(9, ld, p)

  /**
    * generate random points
    * @param extent
    * @return
    */
  def randomPointFeature(extent: Extent): PointFeature[Double] = {
    def randInRange (low: Double, high: Double): Double = {
      val x = Random.nextDouble
      low * (1-x) + high * x
    }
    Feature(Point(randInRange(extent.xmin, extent.xmax),      // the geometry
      randInRange(extent.ymin, extent.ymax)),
      Random.nextInt % 16 + 16)                         // the weight (attribute)
  }

  /**
    * to generate the extent of the kernel centered at a given point
    * @param kwidth
    * @param ld
    * @param ptf
    * @tparam D
    * @return
    */
  def pointFeatureToExtent[D](kwidth: Double, ld: LayoutDefinition, ptf: PointFeature[D]): Extent = {
    val p = ptf.geom

    Extent(p.x - kwidth * ld.cellwidth / 2,
      p.y - kwidth * ld.cellheight / 2,
      p.x + kwidth * ld.cellwidth / 2,
      p.y + kwidth * ld.cellheight / 2)
  }

//  def stampPointFeature(
//                         tile: MutableArrayTile,
//                         tup: (SpatialKey, PointFeature[Double])
//                       ): MutableArrayTile = {
//    val (spatialKey, pointFeature) = tup
//    val tileExtent = ld.mapTransform(spatialKey)
//    val re = RasterExtent(tileExtent, tile)
//    val result = tile.copy.asInstanceOf[MutableArrayTile]
//
//    KernelStamper(result, kern)
//      .stampKernelDouble(re.mapToGrid(pointFeature.geom), pointFeature.data)
//
//    result
//  }


}