Python数据分析【3】:pandas库详细教程
Python数据分析:pandas库详细教程
- 1. series和读取外部数据
-
- 1.1 前言
- 1.2 数据类型
- 1.3 Series创建
- 1.4 Series索引和切片
- 1.5 Series索引和值
- 1.6 读取外部数据
- 1.7 DataFrame
- 1.8 取行取列
- 1.9 loc
- 1.10 布尔索引
- 1.11 字符串方法
- 1.12 缺失数据的处理
- 2. 统计方法和字符串离散化
-
- 2.1 常用统计方法
- 2.2 电影数据直方图
- 3. 数据的合并和分组聚合
-
- 3.1 数据离散化
- 3.2 数据合并(join和merge)
- 3.3 数组分组聚合(groupby)
- 3.4 数据的索引学习
- 3.5 数据的符合索引
- 4. 时间序列
- 5. pandas案例(PM2.5)
1. series和读取外部数据
1.1 前言
numpy:处理数据
matplotlib:数据分析
pandas:除处理数值之外,还能处理其他类型的数据(字符串,时间序列)。比如:通过爬虫获取到了存储在数据库中的数据;之前YouTube例子中除了数值之外,还有国家信息、视频分类(tag)信息,标题信息等
1.2 数据类型
- Series:一维,带标签数组
- DataFrame:二维,Series容器
1.3 Series创建
Series:本质上由两个数组构成,一个数组构成对象的键(index, 索引),一个数组构成对象的值(values), 键->值
import pandas as pd
t=pd.Series([1,2,31,12,3,4])
>>>0     1
1     2
2    31
3    12
4     3
5     4
dtype: int64

type(t)
>>>pandas.core.series.Series

t1=pd.Series([1,23,2,2,1],index=list('abcde'))
>>>a     1
b    23
c     2
d     2
e     1
dtype: int64

temp_dict={
     'name':'xiaohong','age':30,'tel':'10086'}
t2=pd.Series(temp_dict)
>>>name    xiaohong
age           30
tel        10086
dtype: object
1.4 Series索引和切片
temp_dict={
     'name':'xiaohong','age':30,'tel':'10086'}
t2=pd.Series(temp_dict)
>>>name    xiaohong
age           30
tel        10086
dtype: object

# 索引
t2['age']
>>>30

t2[0]
>>>'xiaohong'

t2[['age','tel']]
>>>age       30
tel    10086
dtype: object

# 切片
t2[1:2]
>>>age    30
dtype: object
1.5 Series索引和值
temp_dict={
     'name':'xiaohong','age':30,'tel':'10086'}
t2=pd.Series(temp_dict)
>>>name    xiaohong
age           30
tel        10086
dtype: object

# 索引
t2.index
>>>Index(['name', 'age', 'tel'], dtype='object')

for i in t2.index:
	print(i)
>>>name
age
tel

type(t2.index)  # 获取类型
>>>pandas.core.indexes.base.Index
len(t2.index)  # 获取长度
>>>3
list(t2.index)  # 获取列表
>>>['name', 'age', 'tel']


# 值
t2.values
>>>array(['xiaohong', 30, '10086'], dtype=object)
type(t2.values)  # 获取类型
>>>numpy.ndarray
ndarray的很多方法都可以运用于series类型,比如argmax, clip
series具有where方法,但是结果和ndarray不同
百度搜索官网文档:padas Series where
1.6 读取外部数据
CSV数据:pd.read_csv
myql数据:pd.read_sql(sql_sentence,connection)
mongodb:第三方库(from pymongo import MongoClient )
import pandas as pd
# pandas读取csv中的文件
df=pd.read_csv('dogNames2.csv')
# 数据链接:https://www.kaggle.com/new-york-city/nyc-dog-names/data
print(df)
>>> Row_Labels  Count_AnimalName
0              1                 1
1              2                 2
2          40804                 1
3          90201                 1
4          90203                 1
...          ...               ...
16215      37916                 1
16216      38282                 1
16217      38583                 1
16218      38948                 1
16219      39743                 1

[16220 rows x 2 columns]
1.7 DataFrame
DataFrame既有行索引,也有列索引
-行索引:表明不同行,横向索引,叫index,0轴,axis=0
-列索引:表明不同列,纵向索引,叫columns,1轴,axis=1
import pandas as pd
import numpy as np
pd.DataFrame(np.arange(12).reshape(3,4))
>>>
    0	1	2	3
0	0	1	2	3
1	4	5	6	7
2	8	9	10	11
# 竖着是行索引,横着是列索引

pd.DataFrame(np.arange(12).reshape(3,4),index=list('abc'),columns=list('WXYZ'))
>>>
    W	X	Y	Z
a	0	1	2	3
b	4	5	6	7
c	8	9	10	11
d1={
     'name':['xiaohong','xiaoming'],'age':[20,32],'tel':[10086,10010]}
t1=pd.DataFrame(d1)
>>>
        name	age	tel
0	xiaohong	20	10086
1	xiaoming	32	10010
type(t1)
>>>pandas.core.frame.DataFrame

d2=[{
     'name':'xiaohong','age':32,'tel':'10010'},{
     'name':'xiaogang','tel':'10000'},{
     'name':'xiaowang','age':22}]
t2=pd.DataFrame(d2)
>>>
        name	age	tel
0	xiaohong	32.0	10010
1	xiaogang	NaN	10000
2	xiaowang	22.0	NaN

# DataFrame的基础属性
t2.index  # 行索引
>>>RangeIndex(start=0, stop=3, step=1)
t2.columns  # 列索引
>>>Index(['name', 'age', 'tel'], dtype='object')
t2.values  # 对象值,二维ndarray数组
>>>array([['xiaohong', 32.0, '10010'],
       ['xiaogang', nan, '10000'],
       ['xiaowang', 22.0, nan]], dtype=object)
t2.shape  # 行数 列数
>>>(3, 3)
t2.dtypes  # 列数据类型
>>>name     object
age     float64
tel      object
dtype: object
t2.ndim  # 数据维度
>>>2

# DataFrame的整体情况查询
t2.head(a)  # 显示头部几行
t2.tail(b)  # 显示末尾几行
t2.info()  # 相关信息概览:行数,列数,列索引,列非空值个数,列类型,内存占用
t2.describe()  # 快速综合统计结果:计数,均值,标准差,最大值,最小值,四分位数
from pymongo import MongoClient

client=MongoClient()
collection=client['douban']['tv1']
data=collection.find()
data_list=[]
for i in data:
	temp={
     }
	temp['info']=i['info']
	temp['rating_count']=i['rating']['count']
	temp['rating_value']=i['rating']['value']
	temp['title']=i['title']
	temp['country']=i['tv_category']
	temp['directors']=i['directors']
	temp['actors']=i['actors']
	data_list.append(temp)

df=pd.DataFrame(data_list)
print(df)
1.8 取行取列
import pandas as pd
# pandas读取csv中的文件
df=pd.read_csv('dogNames2.csv')
# 数据链接:https://www.kaggle.com/new-york-city/nyc-dog-names/data

print(df.head())
print(df.info())
>>>  Row_Labels  Count_AnimalName
0          1                 1
1          2                 2
2      40804                 1
3      90201                 1
4      90203                 1
<class 'pandas.core.frame.DataFrame'>
RangeIndex: 16220 entries, 0 to 16219
Data columns (total 2 columns):
 #   Column            Non-Null Count  Dtype
---  ------            --------------  -----
 0   Row_Labels        16217 non-null  object
 1   Count_AnimalName  16220 non-null  int64
dtypes: int64(1), object(1)
memory usage: 253.6+ KB
None

# 问题:使用次数最高的前几个名字是什么呢?
# DataFrame中排序的方法
df=df.sort_values(by='Count_AnimalName',ascending=False)
df.head(5)  # 取前面5行
# 等价于df[:5]
>>>	Row_Labels	Count_AnimalName
1156	BELLA	1195
9140	MAX	1153
2660	CHARLIE	856
3251	COCO	852
12368	ROCKY	823

# 取前面5行的具体某一列
df[:5]['Row_Labels']
>>>1156       BELLA
9140         MAX
2660     CHARLIE
3251        COCO
12368      ROCKY
Name: Row_Labels, dtype: object
# pandas取行或者取列的注意点
# - [] 写数组,表示取行,对行进行排序
# - [] 写字符串,表示取列索引,对列进行操作

# 问题:如果有10列数据,按照其中第1,3,8列排序(看ipythpn的帮助文档)
1.9 loc
- df.loc: 通过标签索引行数据
- df.iloc:通过位置获取行数据
t3=pd.DataFrame(np.arange(12).reshape(3,4),index=list('abc'),columns=list('WXYZ'))

t3.loc['a','Z']
type(t3.loc['a','Z'])
>>>
    W	X	Y	Z
a	0	1	2	3
b	4	5	6	7
c	8	9	10	11
>>>numpy.int32

# loc
# 取行
t3.loc['a']
>>>W    0
X    1
Y    2
Z    3
Name: a, dtype: int32

# 取列
t3.loc[:,'Y']
>>>a     2
b     6
c    10
Name: Y, dtype: int32

# 取多行
t3.loc[['a','c']]  # 等价于t3.loc[['a','c'],:]
>>>	W	X	Y	Z
a	0	1	2	3
c	8	9	10	11

# 取多列
t3.loc[:,['W','Z']]
>>>	W	Z
a	0	3
b	4	7
c	8	11

# 取间隔的多行多列
t3.loc[['a','c'],['W','Z']]
>>>	W	Z
a	0	3
c	8	11
t3.loc['a':,['W','Z']]
>>>
    W	Z
a	0	3
b	4	7
c	8	11

# iloc
# 取行
t3.iloc[1]
>>>W    4
X    5
Y    6
Z    7
Name: b, dtype: int32

# 取列
t3.iloc[:,2]
>>>a     2
b     6
c    10
Name: Y, dtype: int32

# 取不连续的多行多列
t3.iloc[:,[2,1]]
>>>
    Y	X
a	2	1
b	6	5
c	10	9

# 取连续的多行多列
t3.iloc[[0,2],[2,1]]
>>>
    Y	X
a	2	1
c	10	9

t3.iloc[1:,:3]=10
>>>	W	X	Y	Z
a	0	1	2	3
b	10	10	10	7
c	10	10	10	11

t3.iloc[1:,:2]=np.nan
>>>	W	X	Y	Z
a	0.0	1.0	2	3
b	NaN	NaN	10	7
c	NaN	NaN	10	11
1.10 布尔索引
import pandas as pd
# pandas读取csv中的文件
df=pd.read_csv('dogNames2.csv')
# 数据链接:https://www.kaggle.com/new-york-city/nyc-dog-names/data

# 找到使用次数超过800的狗的名字
df[df['Count_AnimalName']>800]
>>>
   Row_Labels	Count_AnimalName
1156	BELLA	1195
9140	MAX	1153
2660	CHARLIE	856
3251	COCO	852
12368	ROCKY	823

# 找到使用次数800-1000的狗的名字 &或   |且
df[(800<df['Count_AnimalName']) & (df['Count_AnimalName']<1000)]
>>>	Row_Labels	Count_AnimalName
2660	CHARLIE	856
3251	COCO	852
12368	ROCKY	823
1.11 字符串方法
常用:contains, len, lower/upper, replace, split
contains: 返回表示各字符串是否含有指定模式的布尔型数值
# 找到使用次数超过800的狗的名字并且名字的字符串的长度大于4
df[(700<df['Count_AnimalName']) & (df['Row_Labels'].str.len()>4)]
>>>
Row_Labels	Count_AnimalName
1156	BELLA	1195
2660	CHARLIE	856
12368	ROCKY	823
8552	LUCKY	723
1.12 缺失数据的处理
数据缺失有两种情况:
① 空,None等,在pandas是nan(和np.nan一样)
② 没有数据,为0
判断数据是否为nan:pd.isnull(df), pd.notnull(df),
处理方式1:删除nan所在的行列dropna(axis,how=‘any’,inplace=False)
处理方式2:填充数据,t.fillna(t.mean()), t.fillna(t.median()), t.fillna(0),
处理为0的数据:t[t==0]=np.nan
当然并不是每次为0的数据都需要处理
计算平均值等情况,nan是不参与计算的,但是0会
pd.isnull(t3)
>>>	W	X	Y	Z
a	False	False	False	False
b	True	True	False	False
c	True	True	False	False
pd.notnull(t3)
>>>	W	X	Y	Z
a	True	True	True	True
b	False	False	True	True
c	False	False	True	True
t3[pd.notnull(t3['w'])]
>>>	W	X	Y	Z
a	0.0	1.0	2	3

t3.dropna(axis=0,how='all') # 所在行全为nan时,删掉
>>>
     W	X	Y	Z
a	0.0	1.0	2	3
b	NaN	NaN	10	7
c	NaN	NaN	10	11

t3.dropna(axis=0,how='any',inplace=True)  # 所在行有nan时,删掉所在行,并赋值给t3
>>>	W	X	Y	Z
a	0.0	1.0	2	3
d2=[{
     'name':'xiaohong','age':32,'tel':'10010'},{
     'name':'xiaogang','tel':'10000'},{
     'name':'xiaowang','age':22}]
t2=pd.DataFrame(d2)
>>>
        name	age	tel
0	xiaohong	32.0	10010
1	xiaogang	NaN	10000
2	xiaowang	22.0	NaN

t2.fillna(0)  # 将nan的值替换为0
>>>	name	age	tel
0	xiaohong	32.0	10010
1	xiaogang	0.0	10000
2	xiaowang	22.0	0

t2.fillna(t2.mean())  # 将nan的值替换为均值
>>>	name	age	tel
0	xiaohong	32.0	10010
1	xiaogang	27.0	10000
2	xiaowang	22.0	NaN
t2  # t2值不变
>>>	name	age	tel
0	xiaohong	32.0	10010
1	xiaogang	NaN	10000
2	xiaowang	22.0	NaN

t2['age'].fillna(t2['age'].mean())  # 将age中nan的值替换为均值
>>>0    32.0
1    27.0
2    22.0
Name: age, dtype: float64
2. 统计方法和字符串离散化
2.1 常用统计方法
问题:假设现在我们有一组从2006-2016年1000部最流行的电影数据,想知道这些电影数据中评分的平均分,导演的人数等信息,我们应该怎么获取?
数据来源:https://www.kaggle.com/damianpanek/sunday-eda/data
import pandas as pd
import numpy as np

file_path='IMDB-Movie-Data.csv'
df=pd.read_csv(file_path)
print(df.info())
>>><class 'pandas.core.frame.DataFrame'>
RangeIndex: 1000 entries, 0 to 999
Data columns (total 12 columns):
 #   Column              Non-Null Count  Dtype
---  ------              --------------  -----
 0   Rank                1000 non-null   int64
 1   Title               1000 non-null   object
 2   Genre               1000 non-null   object
 3   Description         1000 non-null   object
 4   Director            1000 non-null   object
 5   Actors              1000 non-null   object
 6   Year                1000 non-null   int64
 7   Runtime (Minutes)   1000 non-null   int64
 8   Rating              1000 non-null   float64
 9   Votes               1000 non-null   int64
 10  Revenue (Millions)  872 non-null    float64
 11  Metascore           936 non-null    float64
dtypes: float64(3), int64(4), object(5)
memory usage: 93.9+ KB
None

print(df.head())
>>>  Rank                    Title                     Genre  \
0     1  Guardians of the Galaxy   Action,Adventure,Sci-Fi
1     2               Prometheus  Adventure,Mystery,Sci-Fi
2     3                    Split           Horror,Thriller
3     4                     Sing   Animation,Comedy,Family
4     5            Suicide Squad  Action,Adventure,Fantasy

                                         Description              Director  \
0  A group of intergalactic criminals are forced ...            James Gunn
1  Following clues to the origin of mankind, a te...          Ridley Scott
2  Three girls are kidnapped by a man with a diag...    M. Night Shyamalan
3  In a city of humanoid animals, a hustling thea...  Christophe Lourdelet
4  A secret government agency recruits some of th...            David Ayer

                                              Actors  Year  Runtime (Minutes)  \
0  Chris Pratt, Vin Diesel, Bradley Cooper, Zoe S...  2014                121
1  Noomi Rapace, Logan Marshall-Green, Michael Fa...  2012                124
2  James McAvoy, Anya Taylor-Joy, Haley Lu Richar...  2016                117
3  Matthew McConaughey,Reese Witherspoon, Seth Ma...  2016                108
4  Will Smith, Jared Leto, Margot Robbie, Viola D...  2016                123

   Rating   Votes  Revenue (Millions)  Metascore
0     8.1  757074              333.13       76.0
1     7.0  485820              126.46       65.0
2     7.3  157606              138.12       62.0
3     7.2   60545              270.32       59.0
4     6.2  393727              325.02       40.0

# 获取电影的平均评分
df['Rating'].mean()
>>>6.723200000000003

# 获取导演的人数
len(set(df['Director'].tolist()))
>>>644
# 方法二
len(df['Director'].unique())
>>>644

# 获取演员的人数
temp_actors_list=df['Actors'].str.split(',').tolist()
# 二维数组转变为一维数组
actors_list=[i for j in temp_actors_list for i in j]
actors_num=len(set(actors_list))
print(actors_num)
>>>2394
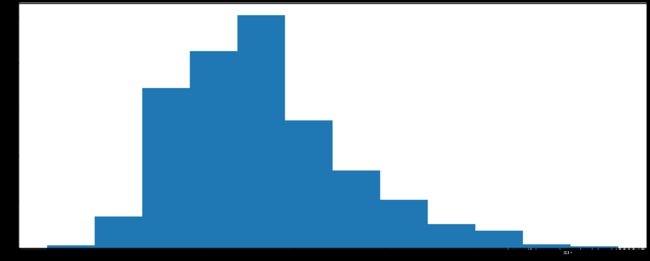
2.2 电影数据直方图
问题:对于一组电影数据,如果我们想rating,runtime的分布情况,应该如何呈现数据?
import pandas as pd
import numpy as np
from matplotlib import pyplot as plt

# 不同数据
file_path='IMDB-Movie-Data.csv'
df=pd.read_csv(file_path)

# runtime分布情况
# 选择图形:直方图
# 准备数据
runtime_data=df['Runtime (Minutes)'].values

max_runtime=runtime_data.max()
min_runtime=runtime_data.min()

# 计算组数
num_bin=(max_runtime-min_runtime)//10
print(type(num_bin))

# 设置图形大小
plt.figure(figsize=(20,8),dpi=80)
plt.hist(runtime_data,num_bin)

plt.show()
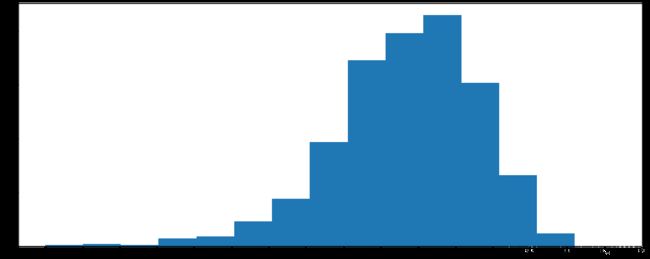
import pandas as pd
import numpy as np
from matplotlib import pyplot as plt

# 不同数据
file_path='IMDB-Movie-Data.csv'
df=pd.read_csv(file_path)

# rating分布情况
# 选择图形:直方图
# 准备数据
runtime_data=df['Rating'].values

max_runtime=runtime_data.max()
min_runtime=runtime_data.min()

# 计算组数
num_bin=int((max_runtime-min_runtime)//0.5)

# 设置图形大小
plt.figure(figsize=(20,8),dpi=80)
plt.hist(runtime_data,num_bin)

# x轴刻度
_x=[min_runtime]
i=min_runtime
while i<=max_runtime+0.5:
	i=i+0.5
	_x.append(i)

plt.xticks(_x)

plt.show()
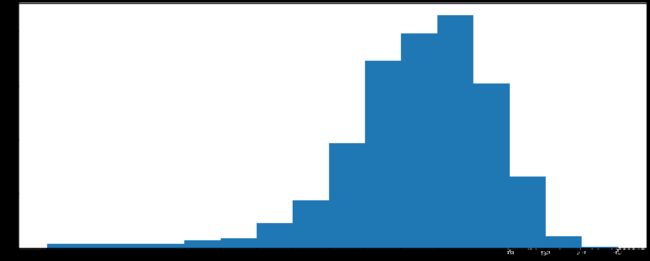
import pandas as pd
import numpy as np
from matplotlib import pyplot as plt

# 不同数据
file_path='IMDB-Movie-Data.csv'
df=pd.read_csv(file_path)

# rating,runtime分布情况
# 选择图形:直方图
# 准备数据
runtime_data=df['Rating'].values

max_runtime=runtime_data.max()
min_runtime=runtime_data.min()

# 计算组数
num_bin_list=[1.6,3.5]
i=3.5
while i<=max_runtime:
	i+=0.5
	num_bin_list.append(i)

# 设置图形大小
plt.figure(figsize=(20,8),dpi=80)
plt.hist(runtime_data,num_bin_list)
plt.xticks(num_bin_list)

plt.show()
3. 数据的合并和分组聚合
3.1 数据离散化
问题:对于这一组电影数据,如果我们我们希望统计电影分类(Genre)的情况,应该如何处理数据?
思路:重新构造一个全为0的数组,列名为分类,如果某一条数据中分类出现过,就让0变为1
import pandas as pd
import numpy as np
from matplotlib import pyplot as plt

# 不同数据
file_path='IMDB-Movie-Data.csv'
df=pd.read_csv(file_path)
df['Genre']
>>>0       Action,Adventure,Sci-Fi
1      Adventure,Mystery,Sci-Fi
2               Horror,Thriller
3       Animation,Comedy,Family
4      Action,Adventure,Fantasy
                 ...
995         Crime,Drama,Mystery
996                      Horror
997         Drama,Music,Romance
998            Adventure,Comedy
999       Comedy,Family,Fantasy
Name: Genre, Length: 1000, dtype: object

# 统计分类的列表
temp_list=df['Genre'].str.split(',').tolist()  # 列表嵌套列表

genre_list=list(set(i for j in temp_list for i in j))  # 去重

# 构造全为0的数组
zeros_df=pd.DataFrame(np.zeros(df.shape[0],len(genre_list)),columns=genre_list)
>>>Animation	Romance	Adventure	Western	History	Fantasy	Sport	Biography	Drama	Sci-Fi	Action	Crime	Horror	Musical	Thriller	Music	Family	War	Comedy	Mystery
0	0.0	0.0	0.0	0.0	0.0	0.0	0.0	0.0	0.0	0.0	0.0	0.0	0.0	0.0	0.0	0.0	0.0	0.0	0.0	0.0
1	0.0	0.0	0.0	0.0	0.0	0.0	0.0	0.0	0.0	0.0	0.0	0.0	0.0	0.0	0.0	0.0	0.0	0.0	0.0	0.0
2	0.0	0.0	0.0	0.0	0.0	0.0	0.0	0.0	0.0	0.0	0.0	0.0	0.0	0.0	0.0	0.0	0.0	0.0	0.0	0.0
3	0.0	0.0	0.0	0.0	0.0	0.0	0.0	0.0	0.0	0.0	0.0	0.0	0.0	0.0	0.0	0.0	0.0	0.0	0.0	0.0
4	0.0	0.0	0.0	0.0	0.0	0.0	0.0	0.0	0.0	0.0	0.0	0.0	0.0	0.0	0.0	0.0	0.0	0.0	0.0	0.0
...	...	...	...	...	...	...	...	...	...	...	...	...	...	...	...	...	...	...	...	...
995	0.0	0.0	0.0	0.0	0.0	0.0	0.0	0.0	0.0	0.0	0.0	0.0	0.0	0.0	0.0	0.0	0.0	0.0	0.0	0.0
996	0.0	0.0	0.0	0.0	0.0	0.0	0.0	0.0	0.0	0.0	0.0	0.0	0.0	0.0	0.0	0.0	0.0	0.0	0.0	0.0
997	0.0	0.0	0.0	0.0	0.0	0.0	0.0	0.0	0.0	0.0	0.0	0.0	0.0	0.0	0.0	0.0	0.0	0.0	0.0	0.0
998	0.0	0.0	0.0	0.0	0.0	0.0	0.0	0.0	0.0	0.0	0.0	0.0	0.0	0.0	0.0	0.0	0.0	0.0	0.0	0.0
999	0.0	0.0	0.0	0.0	0.0	0.0	0.0	0.0	0.0	0.0	0.0	0.0	0.0	0.0	0.0	0.0	0.0	0.0	0.0	0.0
1000 rows × 20 columns

# 给每个电影出现分类的位置赋值为1
for i in range(df.shape[0]):
	# zeros_df.loc[i,['Sci-fi','Mucical]]=1
	zeros_df.loc[i,temp_list[i]]=1
print(zeros_df.head(3))
>>> Animation  Romance  Adventure  Western  History  Fantasy  Sport  Biography  \
0        0.0      0.0        1.0      0.0      0.0      0.0    0.0        0.0
1        0.0      0.0        1.0      0.0      0.0      0.0    0.0        0.0
2        0.0      0.0        0.0      0.0      0.0      0.0    0.0        0.0

   Drama  Sci-Fi  Action  Crime  Horror  Musical  Thriller  Music  Family  \
0    0.0     1.0     1.0    0.0     0.0      0.0       0.0    0.0     0.0
1    0.0     1.0     0.0    0.0     0.0      0.0       0.0    0.0     0.0
2    0.0     0.0     0.0    0.0     1.0      0.0       1.0    0.0     0.0

   War  Comedy  Mystery
0  0.0     0.0      0.0
1  0.0     0.0      1.0
2  0.0     0.0      0.0

# 统计每个分类电影的数量和
genre_count=zeros_df.sum(axis=0)
print(genre_count)
>>>Animation     49.0
Romance      141.0
Adventure    259.0
Western        7.0
History       29.0
Fantasy      101.0
Sport         18.0
Biography     81.0
Drama        513.0
Sci-Fi       120.0
Action       303.0
Crime        150.0
Horror       119.0
Musical        5.0
Thriller     195.0
Music         16.0
Family        51.0
War           13.0
Comedy       279.0
Mystery      106.0
dtype: float64

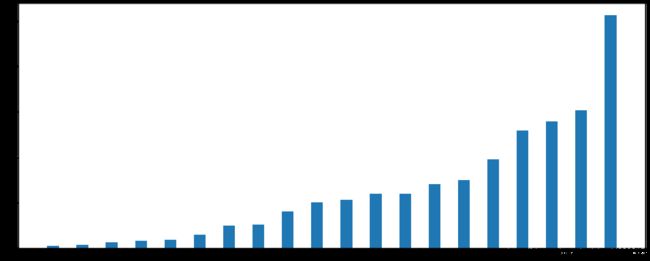
# 排序
genre_count=genre_count.sort_values()

# 画图
_x=genre_count.index
_y=genre_count.values
plt.figure(figsize=(20,8),dpi=80)
plt.bar(range(len(_x)),_y,width=0.4)
plt.xticiks=(range(len(_x)),_x)
plt.show()
3.2 数据合并(join和merge)
join: 默认情况下把行索引相同的数据合并到一起
merge: 默认情况下把列索引相同的数据合并到一起
import pandas as pd
import numpy as np

# join
df1=pd.DataFrame(np.ones((2,4)),index=['A','B'],columns=list('abcd'))
>>> a    b    c    d
A  1.0  1.0  1.0  1.0
B  1.0  1.0  1.0  1.0
df2=pd.DataFrame(np.zeros((3,3)),index=['A','B','C'],columns=list('xyz'))
>>>  x    y    z
A  0.0  0.0  0.0
B  0.0  0.0  0.0
C  0.0  0.0  0.0
df1.join(df2)
>>>a	b	c	d	x	y	z
A	1.0	1.0	1.0	1.0	0.0	0.0	0.0
B	1.0	1.0	1.0	1.0	0.0	0.0	0.0
df2.join(df1)
>>>x	y	z	a	b	c	d
A	0.0	0.0	0.0	1.0	1.0	1.0	1.0
B	0.0	0.0	0.0	1.0	1.0	1.0	1.0
C	0.0	0.0	0.0	NaN	NaN	NaN	NaN

# merge
df3=pd.DataFrame(np.zeros((3,3)),columns=list('fax'))
>>>
f	a	x
0	0.0	0.0	0.0
1	0.0	0.0	0.0
2	0.0	0.0	0.0
df1.merge(df,on='a')
>>>Empty DataFrame

df1=pd.DataFrame(np.ones((2,4)),index=['A','B'],columns=list('abcd'))
>>> a    b    c    d
A  1.0  1.0  1.0  1.0
B  1.0  1.0  1.0  1.0
df4=pd.DataFrame(np.arange(9).reshape((3,3)),columns=list('fax'))
>>>
    f	a	x
0	0	1	2
1	3	4	5
2	6	7	8
df1.merge(df4,on='a',how='inner') # 交集
>>>a	b	c	d	f	x
0	1.0	1.0	1.0	1.0	0	2
1	1.0	1.0	1.0	1.0	0	2
df1.merge(df4,on='a',how='outer') # 并集,nan补全
>>>	a	b	c	d	f	x
0	1.0	1.0	1.0	1.0	0	2
1	1.0	1.0	1.0	1.0	0	2
2	4.0	NaN	NaN	NaN	3	5
3	7.0	NaN	NaN	NaN	6	8
df1.merge(df4,on='a',how='left') # 左连接,nan补全
>>>
a	b	c	d	f	x
0	1.0	1.0	1.0	1.0	0	2
1	1.0	1.0	1.0	1.0	0	2
df1.merge(df4,on='a',how='right') # 右连接,nan补全
>>>a	b	c	d	f	x
0	1.0	1.0	1.0	1.0	0	2
1	1.0	1.0	1.0	1.0	0	2
2	4.0	NaN	NaN	NaN	3	5
3	7.0	NaN	NaN	NaN	6	8
3.3 数组分组聚合(groupby)
问题:现在我们有一组关于全球星巴克店铺的统计数据,如果我想知道美国的星巴克数量和中国的哪个多,或者我想知道中国每个省份星巴克的数量的情况,那么应该怎么办?
数据来源:https://www.kaggle.com/starbucks/store-locations/data
import pandas as pd
import numpy as np
from matplotlib import pyplot as plt

# 不同数据
file_path='directory.csv'
df=pd.read_csv(file_path)
print(df.head(1))
print(df.info())
>>>
Brand  Store Number     Store Name Ownership Type     Street Address  \
0  Starbucks  47370-257954  Meritxell, 96       Licensed  Av. Meritxell, 96

               City State/Province Country Postcode Phone Number  \
0  Andorra la Vella              7      AD    AD500    376818720

                  Timezone  Longitude  Latitude
0  GMT+1:00 Europe/Andorra       1.53     42.51
<class 'pandas.core.frame.DataFrame'>
RangeIndex: 25600 entries, 0 to 25599
Data columns (total 13 columns):
 #   Column          Non-Null Count  Dtype
---  ------          --------------  -----
 0   Brand           25600 non-null  object
 1   Store Number    25600 non-null  object
 2   Store Name      25600 non-null  object
 3   Ownership Type  25600 non-null  object
 4   Street Address  25598 non-null  object
 5   City            25585 non-null  object
 6   State/Province  25600 non-null  object
 7   Country         25600 non-null  object
 8   Postcode        24078 non-null  object
 9   Phone Number    18739 non-null  object
 10  Timezone        25600 non-null  object
 11  Longitude       25599 non-null  float64
 12  Latitude        25599 non-null  float64
dtypes: float64(2), object(11)
memory usage: 2.5+ MB
None

# 分组和聚合
grouped=df.groupby(by='Country')
# 可以进行遍历
#for i,j in grouped:
#	print(i)
#	print('-'*100)
#	print(j,type(j))
#	print('i'*100)
# 等价于
# df[df['Country']]='US'

# 调用聚合方法
country_count=grouped['Brand'].count() # 统计数量
>>>Country
AD        1
AE      144
AR      108
AT       18
AU       22
      ...
TT        3
TW      394
US    13608
VN       25
ZA        3
Name: Brand, Length: 73, dtype: int64

# 统计美国和中国星巴克的数量比较
print(country_count['US'])
print(country_count['CN'])
>>>13608
2734

# 统计中国每个省份的星巴克数量
china_data=df[df['Country']=='CN']
Province_data=china_data.groupby(by='State/Province').count()['Brand'] # 统计数量,DataFrameGroupBy对象
print(Province_data)
>>>State/Province
11    236
12     58
13     24
14      8
15      8
21     57
22     13
23     16
31    551
32    354
33    315
34     26
35     75
36     13
37     75
41     21
42     76
43     35
44    333
45     21
46     16
50     41
51    104
52      9
53     24
61     42
62      3
63      3
64      2
91    162
92     13
Name: Brand, dtype: int64

# 数据按照多个条件分组:对国家和省份进行分组统计,返回series
grouped_CP=df['Brand'].groupby(by=[df['Country'],df['State/Province']]).count()
>>>Country  State/Province
AD       7                  1
AE       AJ                 2
         AZ                48
         DU                82
         FU                 2
                           ..
US       WV                25
         WY                23
VN       HN                 6
         SG                19
ZA       GT                 3
Name: Brand, Length: 545, dtype: int64
# 前两列是索引,第三列才是数据

type(grouped_CP)
>>>pandas.core.series.Series

# 数据按照多个条件分组,返回DataFrame,三种方法
grouped_CP1=df[['Brand']].groupby(by=[df['Country'],df['State/Province']]).count()
grouped_CP2=df.groupby(by=[df['Country'],df['State/Province']])[['Brand']].count()
grouped_CP3=df.groupby(by=[df['Country'],df['State/Province']]).count()[['Brand']]


# 获取分组之后的某一部分数据
df.groupby(by=[df['Country'],df['State/Province']])['Brand'].count()
# 对某几列数据进行分组
df['Brand'].groupby(by=[df['Country'],df['State/Province']]).count()
3.4 数据的索引学习
t1=pd.DataFrame(np.arange(9).reshape((3,3)),columns=list('fax'))
>>>
    f	a	x
0	0	1	2
1	3	4	5
2	6	7	8
# 索引的方法和属性
t1.index  # 获取index
>>>RangeIndex(start=0, stop=3, step=1)
t1.index=['x','y','z']  # 指定index
>>> f  a  x
x  0  1  2
y  3  4  5
z  6  7  8

t1.reindex(list('xoz'))  # 重新设置Index
>>>	f	a	x
x	0.0	1.0	2.0
o	NaN	NaN	NaN
z	6.0	7.0	8.0

t1.set_index('a',drop=False)  # 指定某一列作为Index
>>>
    f	a	x
a
1	0	1	2
4	3	4	5
7	6	7	8

t1.set_index('a',drop=False).index.unique()  # 返回Index的唯一值
>>>Int64Index([1, 4, 7], dtype='int64', name='a')
3.5 数据的符合索引
import pandas as pd
import numpy as np
from matplotlib import pyplot as plt

a=pd.DataFrame({
     'a':range(7),'b':range(7,0,-1),'c':['one','one','one','two','two','two','two'],'d':list('hjklmno')})
>>>	a	b	c	d
0	0	7	one	h
1	1	6	one	j
2	2	5	one	k
3	3	4	two	l
4	4	3	two	m
5	5	2	two	n
6	6	1	two	o

b=a.set_index(['c','d'])  # 指定某一列作为Index
>>>
       a	b
c	d
one	h	0	7
    j	1	6
    k	2	5
two	l	3	4
    m	4	3
    n	5	2
    o	6	1
c=b['a']
>>>
c    d
one  h    0
     j    1
     k    2
two  l    3
     m    4
     n    5
     o    6
Name: a, dtype: int64
c['one']
>>>
d
h    0
j    1
k    2
Name: a, dtype: int64
c['one']['j']
>>>1
d=a.set_index(['d','c'])['a']
>>>
d  c
h  one    0
j  one    1
k  one    2
l  two    3
m  two    4
n  two    5
o  two    6
Name: a, dtype: int64

d.index
>>>MultiIndex([('h', 'one'),
            ('j', 'one'),
            ('k', 'one'),
            ('l', 'two'),
            ('m', 'two'),
            ('n', 'two'),
            ('o', 'two')],
           names=['d', 'c'])
d.swaplevel()
>>>
c    d
one  h    0
     j    1
     k    2
two  l    3
     m    4
     n    5
     o    6
Name: a, dtype: int64

b=a.set_index(['c','d'])  # 指定某一列作为Index
>>>
       a	b
c	d
one	h	0	7
    j	1	6
    k	2	5
two	l	3	4
    m	4	3
    n	5	2
    o	6	1
b.swaplevel().loc['h']
>>>
   a	b
c
one	0	7
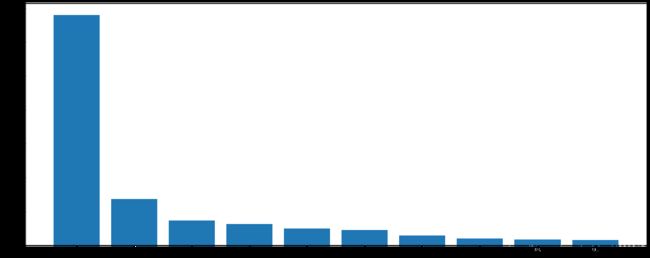
问题:使用matplotlib呈现出店铺总数排名前10的国家;使用matplotlib呈现出中国每个城市的店铺数量;
import pandas as pd
import numpy as np
from matplotlib import pyplot as plt

# 不同数据
file_path='directory.csv'
df=pd.read_csv(file_path)
# 使用matplotlib呈现出店铺总数排名前10的国家
data1=df.groupby(by='Country').count()['Brand'].sort_values(ascending=False)[:10]
_x=data1.index
_y=data1.values

# 画图
plt.figure(figsize=(20,8),dpi=80)
plt.bar(range(len(_x)),_y)
plt.xticks(range(len(_x)),_x)
plt.show()
import pandas as pd
import numpy as np
from matplotlib import pyplot as plt

# 不同数据
file_path='directory.csv'
df=pd.read_csv(file_path)
df=df[df['Country']=='CN']

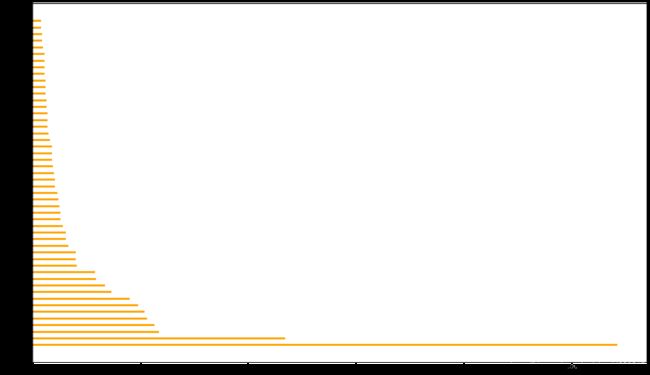
# 使用matplotlib呈现出中国每个城市的店铺数量
data1=df.groupby(by='City').count()['Brand'].sort_values(ascending=False)[:50]
_x=data1.index
_y=data1.values

# 画图
plt.figure(figsize=(20,12),dpi=80)
# plt.bar(range(len(_x)),_y,width=0.3,color='orange')
plt.barn(range(len(_x)),_y,height=0.3,color='orange')
plt.yticks(range(len(_x)),_x,fontproperties='SimHei')
plt.show()
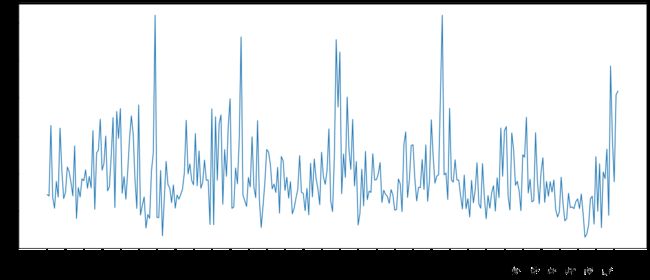
问题:我们有全球排名靠前的10000本书的数据,那么请统计一下下面几个问题
- 不同年份数的数量
- 不同年份的平均评分情况
数据来源:https://www.kaggle.com/zygmunt/goodbooks-10k
import pandas as pd
import numpy as np
from matplotlib import pyplot as plt

# 不同数据
file_path='books.csv'
df=pd.read_csv(file_path)
print(df.head(2))
>>>
id  book_id  best_book_id  work_id  books_count       isbn        isbn13  \
0   1  2767052       2767052  2792775          272  439023483  9.780439e+12
1   2        3             3  4640799          491  439554934  9.780440e+12

                       authors  original_publication_year  \
0              Suzanne Collins                     2008.0
1  J.K. Rowling, Mary GrandPré                     1997.0

                             original_title  ... ratings_count  \
0                          The Hunger Games  ...       4780653
1  Harry Potter and the Philosopher's Stone  ...       4602479

  work_ratings_count  work_text_reviews_count  ratings_1  ratings_2  \
0            4942365                   155254      66715     127936
1            4800065                    75867      75504     101676

   ratings_3  ratings_4  ratings_5  \
0     560092    1481305    2706317
1     455024    1156318    3011543

                                           image_url  \
0  https://images.gr-assets.com/books/1447303603m...
1  https://images.gr-assets.com/books/1474154022m...

                                     small_image_url
0  https://images.gr-assets.com/books/1447303603s...
1  https://images.gr-assets.com/books/1474154022s...

[2 rows x 23 columns]

print(df.info())
>>>
<class 'pandas.core.frame.DataFrame'>
RangeIndex: 10000 entries, 0 to 9999
Data columns (total 23 columns):
 #   Column                     Non-Null Count  Dtype
---  ------                     --------------  -----
 0   id                         10000 non-null  int64
 1   book_id                    10000 non-null  int64
 2   best_book_id               10000 non-null  int64
 3   work_id                    10000 non-null  int64
 4   books_count                10000 non-null  int64
 5   isbn                       9300 non-null   object
 6   isbn13                     9415 non-null   float64
 7   authors                    10000 non-null  object
 8   original_publication_year  9979 non-null   float64
 9   original_title             9415 non-null   object
 10  title                      10000 non-null  object
 11  language_code              8916 non-null   object
 12  average_rating             10000 non-null  float64
 13  ratings_count              10000 non-null  int64
 14  work_ratings_count         10000 non-null  int64
 15  work_text_reviews_count    10000 non-null  int64
 16  ratings_1                  10000 non-null  int64
 17  ratings_2                  10000 non-null  int64
 18  ratings_3                  10000 non-null  int64
 19  ratings_4                  10000 non-null  int64
 20  ratings_5                  10000 non-null  int64
 21  image_url                  10000 non-null  object
 22  small_image_url            10000 non-null  object
dtypes: float64(3), int64(13), object(7)
memory usage: 1.8+ MB
None

# 1. 不同年份数的数量
# 删除original_publication_year列中有缺失的字段
data1=df[pd.notnull(df['original_publication_year'])]
grouped1=data1.groupby(by='original_publication_year').count()['title']
>>>original_publication_year
-1750.0      1
-762.0       1
-750.0       2
-720.0       1
-560.0       1
          ...
 2013.0    518
 2014.0    437
 2015.0    306
 2016.0    198
 2017.0     11
Name: title, Length: 293, dtype: int64
# 负数是公元前

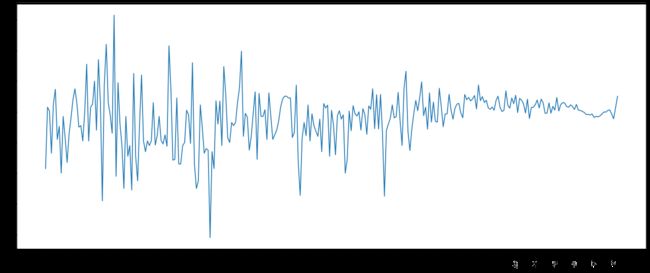
# 2. 不同年份的平均评分情况
# 删除original_publication_year列中有缺失的字段
data2=df[pd.notnull(df['original_publication_year'])]
grouped2=data2['average_rating'].groupby(by=data2['original_publication_year']).mean()
>>>original_publication_year
-1750.0    3.630000
-762.0     4.030000
-750.0     4.005000
-720.0     3.730000
-560.0     4.050000
             ...
 2013.0    4.012297
 2014.0    3.985378
 2015.0    3.954641
 2016.0    4.027576
 2017.0    4.100909
Name: average_rating, Length: 293, dtype: float64

_x=grouped2.index
_y=grouped2.values

# 画图
plt.figure(figsize=(20,8),dpi=80)
plt.plot(range(len(_x)),_y)
plt.xticks(list(range(len(_x)))[::10],_x[::10].astype(int),rotation=90)
plt.show()
4. 时间序列
问题:现在我们有2015-2017年25万条911的紧急电话的数据,请统计出这些数据中不同类型的紧急情况的次数,如果我们还想统计出不同月份不同类型紧急电话的次数的变化情况,应该怎么做呢?
数据来源:https://www.kaggle.com/mchirico/montcoalert/data
import pandas as pd
from matplotlib import pyplot as plt
import numpy as np
df=pd.read_csv('911.csv')
df.head() # 前五条信息
>>> lat lng desc zip title timeStamp twp addr e
0 40.297876 -75.581294 REINDEER CT & DEAD END; NEW HANOVER; Station ... 19525.0 EMS: BACK PAINS/INJURY 2015-12-10 17:10:52 NEW HANOVER REINDEER CT & DEAD END 1
1 40.258061 -75.264680 BRIAR PATH & WHITEMARSH LN; HATFIELD TOWNSHIP... 19446.0 EMS: DIABETIC EMERGENCY 2015-12-10 17:29:21 HATFIELD TOWNSHIP BRIAR PATH & WHITEMARSH LN 1
2 40.121182 -75.351975 HAWS AVE; NORRISTOWN; 2015-12-10 @ 14:39:21-St... 19401.0 Fire: GAS-ODOR/LEAK 2015-12-10 14:39:21 NORRISTOWN HAWS AVE 1
3 40.116153 -75.343513 AIRY ST & SWEDE ST; NORRISTOWN; Station 308A;... 19401.0 EMS: CARDIAC EMERGENCY 2015-12-10 16:47:36 NORRISTOWN AIRY ST & SWEDE ST 1
4 40.251492 -75.603350 CHERRYWOOD CT & DEAD END; LOWER POTTSGROVE; S... NaN EMS: DIZZINESS 2015-12-10 16:56:52 LOWER POTTSGROVE CHERRYWOOD CT & DEAD END 1
df.info() # 基本信息
>>><class 'pandas.core.frame.DataFrame'>
RangeIndex: 634774 entries, 0 to 634773
Data columns (total 9 columns):
# Column Non-Null Count Dtype
--- ------ -------------- -----
0 lat 634774 non-null float64
1 lng 634774 non-null float64
2 desc 634774 non-null object
3 zip 557625 non-null float64
4 title 634774 non-null object
5 timeStamp 634774 non-null object
6 twp 634502 non-null object
7 addr 634774 non-null object
8 e 634774 non-null int64
dtypes: float64(3), int64(1), object(5)
memory usage: 43.6+ MB
# 1. 获取不同类型的紧急情况的次数('title')
# 获取分类情况
temp_list=df['title'].str.split(':').tolist() # series是tolist,DataFrame是to_list
cate_list=list(set([i[0] for i in temp_list])) # 取第1列
print('cate_list')
>>>['EMS', 'Fire', 'Traffic']
# 构造全为0的数组
zeros_df=pd.DataFrame(np.zeros((df.shape[0],len(cate_list))),columns=cate_list)
# 赋值
for cate in cate_list:
zeros_df[cate][df['title'].str.contains(cate)]=1
print(zeros_df)
>>>
Traffic Fire EMS
0 0.0 0.0 1.0
1 0.0 0.0 1.0
2 0.0 1.0 0.0
3 0.0 0.0 1.0
4 0.0 0.0 1.0
... ... ... ...
634769 0.0 0.0 1.0
634770 0.0 1.0 0.0
634771 0.0 0.0 1.0
634772 0.0 0.0 1.0
634773 0.0 0.0 1.0
[634774 rows x 3 columns]
# 第二种方法,速度很慢
#for i in range(df.shape[0]):
# zeros_df.loc[i,temp_list[i][0]]=1
#print(zeros_df)
# 求和
sum_ret=zeros_df.sum(axis=0)
>>>Traffic 222192.0
Fire 95236.0
EMS 317353.0
dtype: float64
# 第二种求和方法,更简单
cate_list=[i[0] for i in temp_list] # 取第1列
df['cate']=pd.DataFrame(np.array(cate_list).reshape((df.shape[0],1)))
print(df['cate'])
>>>
lat lng desc \
0 40.297876 -75.581294 REINDEER CT & DEAD END; NEW HANOVER; Station ...
1 40.258061 -75.264680 BRIAR PATH & WHITEMARSH LN; HATFIELD TOWNSHIP...
2 40.121182 -75.351975 HAWS AVE; NORRISTOWN; 2015-12-10 @ 14:39:21-St...
3 40.116153 -75.343513 AIRY ST & SWEDE ST; NORRISTOWN; Station 308A;...
4 40.251492 -75.603350 CHERRYWOOD CT & DEAD END; LOWER POTTSGROVE; S...
zip title timeStamp twp \
0 19525.0 EMS: BACK PAINS/INJURY 2015-12-10 17:10:52 NEW HANOVER
1 19446.0 EMS: DIABETIC EMERGENCY 2015-12-10 17:29:21 HATFIELD TOWNSHIP
2 19401.0 Fire: GAS-ODOR/LEAK 2015-12-10 14:39:21 NORRISTOWN
3 19401.0 EMS: CARDIAC EMERGENCY 2015-12-10 16:47:36 NORRISTOWN
4 NaN EMS: DIZZINESS 2015-12-10 16:56:52 LOWER POTTSGROVE
addr e cate
0 REINDEER CT & DEAD END 1 EMS
1 BRIAR PATH & WHITEMARSH LN 1 EMS
2 HAWS AVE 1 Fire
3 AIRY ST & SWEDE ST 1 EMS
4 CHERRYWOOD CT & DEAD END 1 EMS
df.groupby(by='cate').count()['title'] # 求和
>>>
cate
EMS 317346
Fire 95236
Traffic 222192
Name: title, dtype: int64
# 总结:构造数组→赋值→求和
生成一段时间范围:pd.date_range(start=None,end=None,periods=None,freq=‘D’)
-start:起始时间
-end:结束时间
-periods: 生成个数
-freq:时间间隔
频率缩写:
| 字母 | 说明 |
|---|---|
| D | Day: 每日历日 |
| B | BusinessDay: 每工作日 |
| H | Hour: 每小时 |
| T | Minute: 每分 |
| S | Second: 每秒 |
| L | Milli: 每毫秒 |
| U | Micro: 每微秒 |
| M | MonthEnd: 每月最后一个日历日 |
| BM | BusinessMonthEnd: 每月最后一个工作日 |
| MS | MonthBegin: 每日第一个日历日 |
| BMS | BusinessMonthBegin: 每日第一个工作日 |
时间字符串转化为时间序列:
df[‘timeStamp’]=pd.to_datetime(df[‘timeStamp’],format=’’)
pandas重采样:resample, 指的是将时间序列从一个频率转化为另一个频率进行处理的过程,将高频率数据转化为低频率数据为降采样,低频率数据转化为高频率为升采样。
pd.date_range(start='20171230',end='20180131',freq='D')
>>>
DatetimeIndex(['2017-12-30', '2017-12-31', '2018-01-01', '2018-01-02',
               '2018-01-03', '2018-01-04', '2018-01-05', '2018-01-06',
               '2018-01-07', '2018-01-08', '2018-01-09', '2018-01-10',
               '2018-01-11', '2018-01-12', '2018-01-13', '2018-01-14',
               '2018-01-15', '2018-01-16', '2018-01-17', '2018-01-18',
               '2018-01-19', '2018-01-20', '2018-01-21', '2018-01-22',
               '2018-01-23', '2018-01-24', '2018-01-25', '2018-01-26',
               '2018-01-27', '2018-01-28', '2018-01-29', '2018-01-30',
               '2018-01-31'],
              dtype='datetime64[ns]', freq='D')
pd.date_range(start='20171230',end='20180131',freq='10D')
>>>DatetimeIndex(['2017-12-30', '2018-01-09', '2018-01-19', '2018-01-29'], dtype='datetime64[ns]', freq='10D')

pd.date_range(start='20171230',periods=10,freq='D')
>>>DatetimeIndex(['2017-12-30', '2017-12-31', '2018-01-01', '2018-01-02',
               '2018-01-03', '2018-01-04', '2018-01-05', '2018-01-06',
               '2018-01-07', '2018-01-08'],
              dtype='datetime64[ns]', freq='D')

index=pd.date_range('20200510',periods=10)
df=pd.DataFrame(np.random.rand(10),index=index)
>>>
0
2020-05-10	0.602105
2020-05-11	0.539859
2020-05-12	0.038534
2020-05-13	0.001627
2020-05-14	0.110605
2020-05-15	0.602238
2020-05-16	0.579460
2020-05-17	0.081276
2020-05-18	0.125397
2020-05-19	0.762709


import pandas as pd
from matplotlib import pyplot as plt
import numpy as np

df=pd.read_csv('911.csv')
df['timeStamp']=pd.to_datetime(df['timeStamp']) # 时间字符转化成时间序列
df.set_index('timeStamp',inplace=True)
print(df.head(5))
>>>
                          lat        lng  \
timeStamp
2015-12-10 17:10:52  40.297876 -75.581294
2015-12-10 17:29:21  40.258061 -75.264680
2015-12-10 14:39:21  40.121182 -75.351975
2015-12-10 16:47:36  40.116153 -75.343513
2015-12-10 16:56:52  40.251492 -75.603350

                                                                  desc  \
timeStamp
2015-12-10 17:10:52  REINDEER CT & DEAD END;  NEW HANOVER; Station ...
2015-12-10 17:29:21  BRIAR PATH & WHITEMARSH LN;  HATFIELD TOWNSHIP...
2015-12-10 14:39:21  HAWS AVE; NORRISTOWN; 2015-12-10 @ 14:39:21-St...
2015-12-10 16:47:36  AIRY ST & SWEDE ST;  NORRISTOWN; Station 308A;...
2015-12-10 16:56:52  CHERRYWOOD CT & DEAD END;  LOWER POTTSGROVE; S...

                         zip                    title                twp  \
timeStamp
2015-12-10 17:10:52  19525.0   EMS: BACK PAINS/INJURY        NEW HANOVER
2015-12-10 17:29:21  19446.0  EMS: DIABETIC EMERGENCY  HATFIELD TOWNSHIP
2015-12-10 14:39:21  19401.0      Fire: GAS-ODOR/LEAK         NORRISTOWN
2015-12-10 16:47:36  19401.0   EMS: CARDIAC EMERGENCY         NORRISTOWN
2015-12-10 16:56:52      NaN           EMS: DIZZINESS   LOWER POTTSGROVE

                                           addr  e
timeStamp
2015-12-10 17:10:52      REINDEER CT & DEAD END  1
2015-12-10 17:29:21  BRIAR PATH & WHITEMARSH LN  1
2015-12-10 14:39:21                    HAWS AVE  1
2015-12-10 16:47:36          AIRY ST & SWEDE ST  1
2015-12-10 16:56:52    CHERRYWOOD CT & DEAD END  1

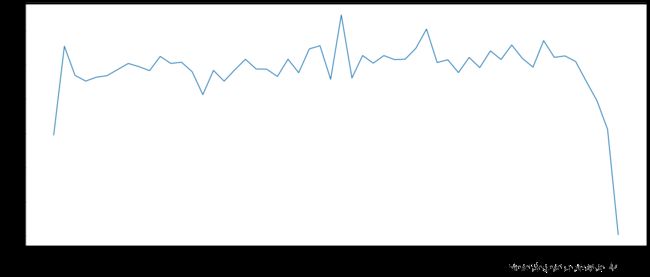
# 1. 统计出911数据中不同月份电话次数的变化情况
count_by_month=df.resample('M').count()['title']
print(count_by_month)

# 画图
_x=count_by_month.index
_y=count_by_month.values

_x=[i.strftime('%Y%m%d') for i in _x]

plt.figure(figsize=(20,8),dpi=80)
plt.plot(range(len(_x)),_y)
plt.xticks(range(len(_x)),_x,rotation=45)
plt.show()
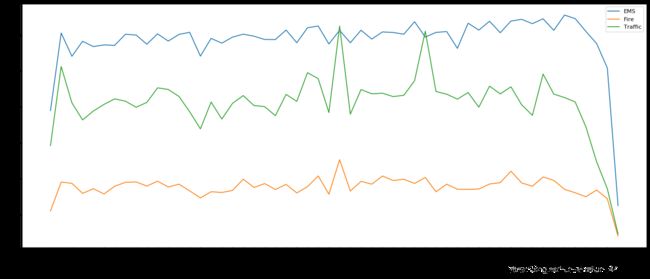
# 2. 统计出911数据中不同月份不同类型电话次数的变化情况
import pandas as pd
from matplotlib import pyplot as plt
import numpy as np

# 时间字符转化成时间序列 设置为索引
df=pd.read_csv('911.csv')
df['timeStamp']=pd.to_datetime(df['timeStamp'])
# 添加列,表示分类
temp_list=df['title'].str.split(':').tolist()
cate_list=[i[0] for i in temp_list]
df['cate']=pd.DataFrame(np.array(cate_list).reshape((df.shape[0],1)))
df.set_index('timeStamp',inplace=True)

plt.figure(figsize=(20,8),dpi=80)

# 不同类型分组
for group_name,group_data in df.groupby(by='cate'):
	# 对不同的分类都进行绘图
	count_by_month=group_data.resample('M').count()['title']

	# 画图
	_x=count_by_month.index
	_y=count_by_month.values
	_x=[i.strftime('%Y%m%d') for i in _x]
	plt.plot(range(len(_x)),_y,label=group_name)

plt.xticks(range(len(_x)),_x,rotation=45)
plt.legend(loc='best')
plt.show()
5. pandas案例(PM2.5)
问题:现在我们有北上广、深圳、和沈阳5个城市空气质量数据,请绘制出5个城市的PM2.5随时间的变化情况
观察这组数据中的时间结构,并不是字符串,这个时候我们应该怎么办?
数据来源:https://www.kaggle.com/uciml/pm25-data-for-five-chinese-cities
import pandas as pd
from matplotlib import pyplot as plt
import numpy as np

# 读取数据
df=pd.read_csv('BeijingPM20100101_20151231.csv')
print(df.head(5))
>>>  No  year  month  day  hour  season  PM_Dongsi  PM_Dongsihuan  \
0   1  2010      1    1     0       4        NaN            NaN
1   2  2010      1    1     1       4        NaN            NaN
2   3  2010      1    1     2       4        NaN            NaN
3   4  2010      1    1     3       4        NaN            NaN
4   5  2010      1    1     4       4        NaN            NaN

   PM_Nongzhanguan  PM_US Post  DEWP  HUMI    PRES  TEMP cbwd    Iws  \
0              NaN         NaN -21.0  43.0  1021.0 -11.0   NW   1.79
1              NaN         NaN -21.0  47.0  1020.0 -12.0   NW   4.92
2              NaN         NaN -21.0  43.0  1019.0 -11.0   NW   6.71
3              NaN         NaN -21.0  55.0  1019.0 -14.0   NW   9.84
4              NaN         NaN -20.0  51.0  1018.0 -12.0   NW  12.97

   precipitation  Iprec
0            0.0    0.0
1            0.0    0.0
2            0.0    0.0
3            0.0    0.0
4            0.0    0.0
<class 'pandas.core.frame.DataFrame'>

print(df.info())
>>>RangeIndex: 52584 entries, 0 to 52583
Data columns (total 18 columns):
 #   Column           Non-Null Count  Dtype
---  ------           --------------  -----
 0   No               52584 non-null  int64
 1   year             52584 non-null  int64
 2   month            52584 non-null  int64
 3   day              52584 non-null  int64
 4   hour             52584 non-null  int64
 5   season           52584 non-null  int64
 6   PM_Dongsi        25052 non-null  float64
 7   PM_Dongsihuan    20508 non-null  float64
 8   PM_Nongzhanguan  24931 non-null  float64
 9   PM_US Post       50387 non-null  float64
 10  DEWP             52579 non-null  float64
 11  HUMI             52245 non-null  float64
 12  PRES             52245 non-null  float64
 13  TEMP             52579 non-null  float64
 14  cbwd             52579 non-null  object
 15  Iws              52579 non-null  float64
 16  precipitation    52100 non-null  float64
 17  Iprec            52100 non-null  float64
dtypes: float64(11), int64(6), object(1)
memory usage: 7.2+ MB
None
PeriodIndex: 时间段
DatetimeIndex: 时间戳
periods=PeriodIndex(year=data[‘year’],month=data[‘month’],day=data[‘day’],hour=data[‘hour’],freq=‘H’)
# 读取数据
df=pd.read_csv('BeijingPM20100101_20151231.csv')

# 把分开的时间字符串通过periodindex的方法转化为pandas的时间类型
df['datetime']=period
period=pd.PeriodIndex(year=df['year'],month=df['month'],day=df['day'],hour=df['hour'],freq='H')
df['datetime']=period # 添加一列
print(period)
print(type(period))
>>>PeriodIndex(['2010-01-01 00:00', '2010-01-01 01:00', '2010-01-01 02:00',
             '2010-01-01 03:00', '2010-01-01 04:00', '2010-01-01 05:00',
             '2010-01-01 06:00', '2010-01-01 07:00', '2010-01-01 08:00',
             '2010-01-01 09:00',
             ...
             '2015-12-31 14:00', '2015-12-31 15:00', '2015-12-31 16:00',
             '2015-12-31 17:00', '2015-12-31 18:00', '2015-12-31 19:00',
             '2015-12-31 20:00', '2015-12-31 21:00', '2015-12-31 22:00',
             '2015-12-31 23:00'],
            dtype='period[H]', length=52584, freq='H')
<class 'pandas.core.indexes.period.PeriodIndex'>

# 把datetime设置为索引
df.set_index('datetime',inplace=True)
# 进行降采样
df=df.resample('7D').mean()

# 绘制北京的变化情况
# 处理缺失数据(PM_US Post),删除缺失数据
data=df['PM_US Post'].dropna()

# 画图
_x=data.index
_x=[i.strftime('%Y%m%d') for i in _x]
_y=data.values

plt.figure(figsize=(20,8),dpi=80)
plt.plot(range(len(_x)),_y)
plt.xticks(range(0,len(_x),10),list(_x)[::10],rotation=45)
plt.show()
