halcon如何识别圆形
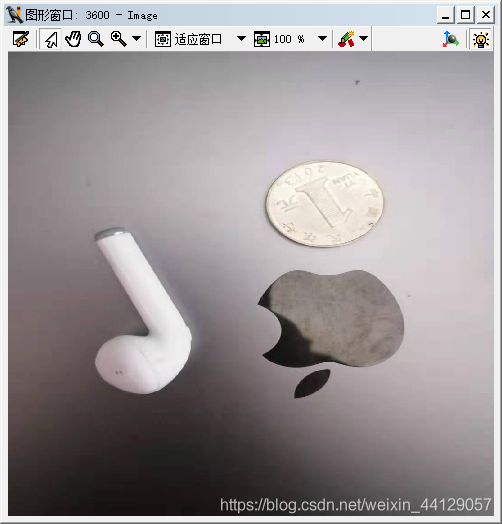
读图片,这里是我自己随便拍的一张图片,使用read_image算子
使用灰度图直方图工具划分图像区域
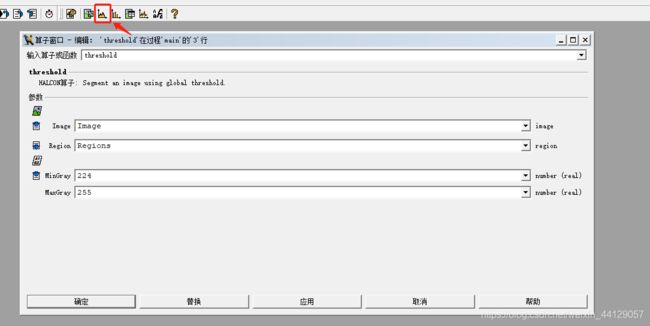
这里要是能输出,选中那个带×的阈值才能进行操作
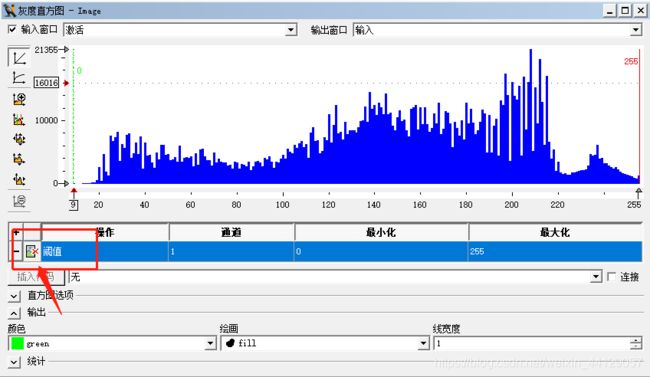
选中之后,默认的是最大范围0-255
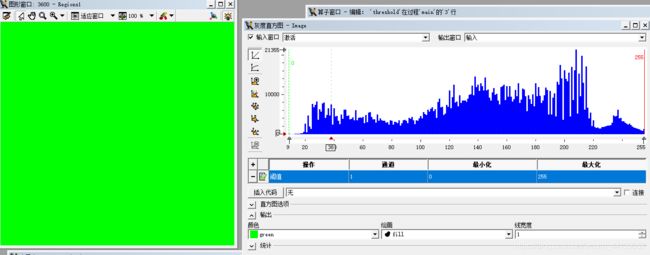
需要自己调整阈值区域以选中圆形
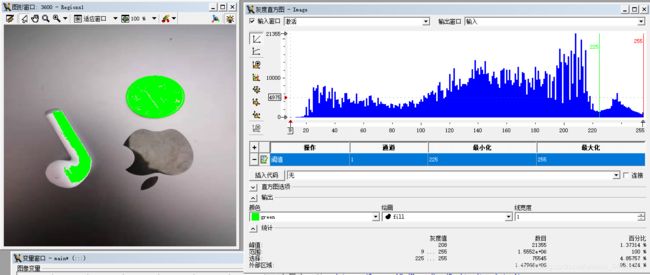
调整到这可以完整的选中圆形,接下来插入代码
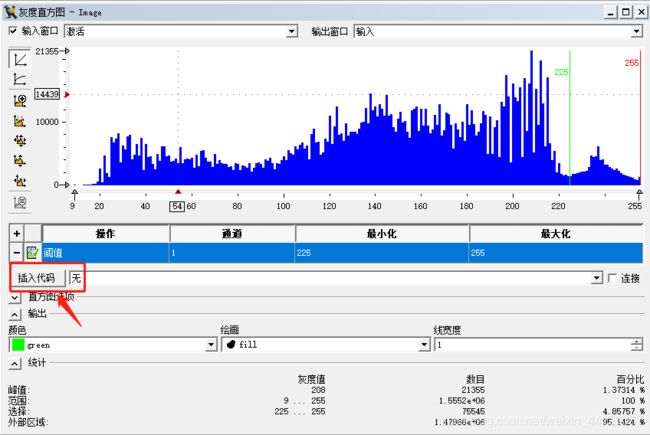
会自动生成代码threshold (Image, Regions, 225, 255)
这里的区域包含的不止有圆形,还有部分耳机
连通阈connection (Regions, ConnectedRegions)
根据面积选择特征,这里也用工具,选中特征直方图
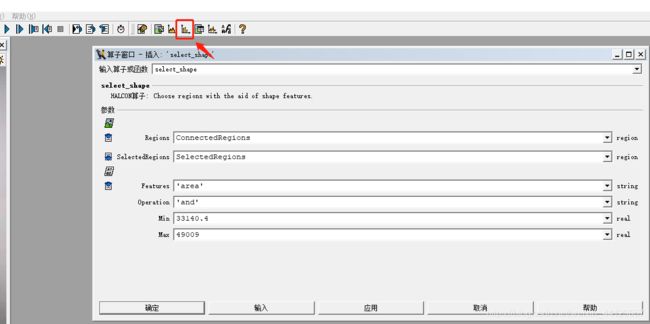
和灰度直方图同样的操作,使能输出
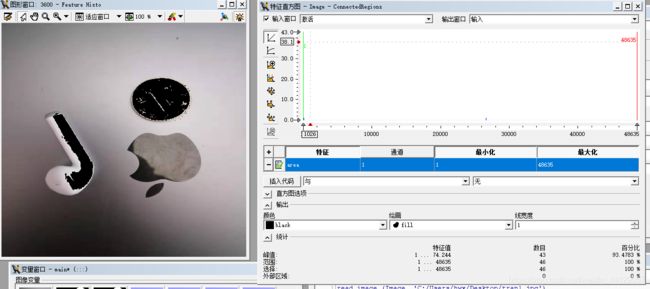
拖动上方坐标中的线来选中硬币区域,选中的用黑色表示,这里可以随便换什么颜色,能清楚的分辨就好
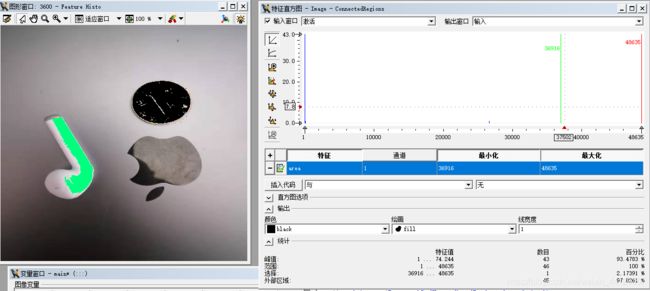
再点插入代码自动生成select_shape (ConnectedRegions, SelectedRegions, 'area', 'and', 36916, 48635)
这里能看到被选中的硬币中还有很多孔洞,选择膨胀算子,对孔洞进行填补dilation_circle (SelectedRegions, RegionDilation, 7),可以从图像变量上看到孔洞已经被填补了

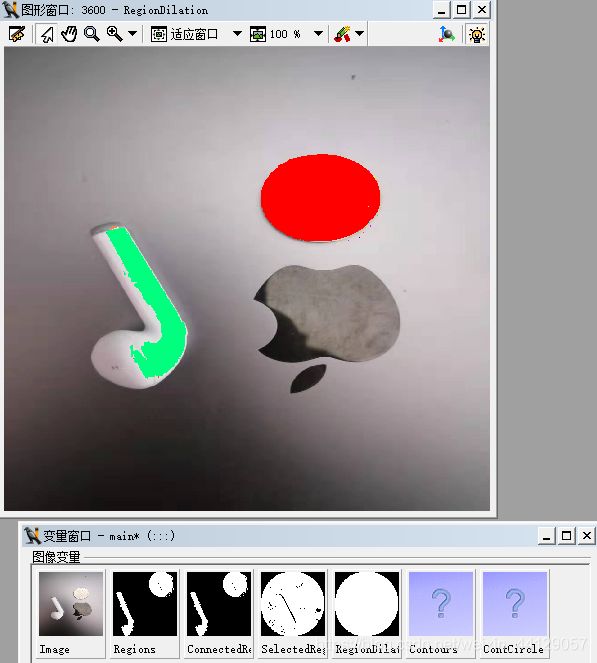
使用算子gen_contour_region_xld (RegionDilation, Contours, 'center')生成区域轮廓
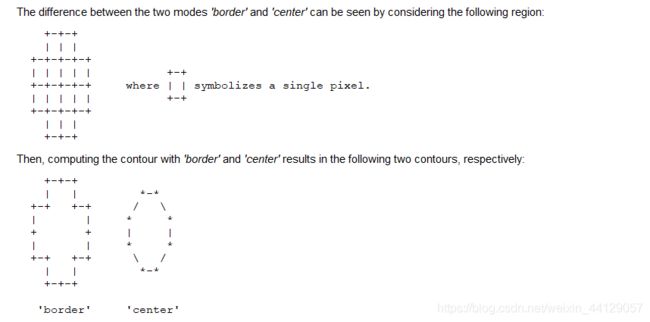
关于gen_contour_region_xld算子的参数可以看下图,很容易明白
算子fit_circle_contour_xld (Contours, 'algebraic', -1, 0, 0, 3, 2, Row, Column, Radius, StartPhi, EndPhi, PointOrder)把轮廓近似拟合成圆。
最终结果:
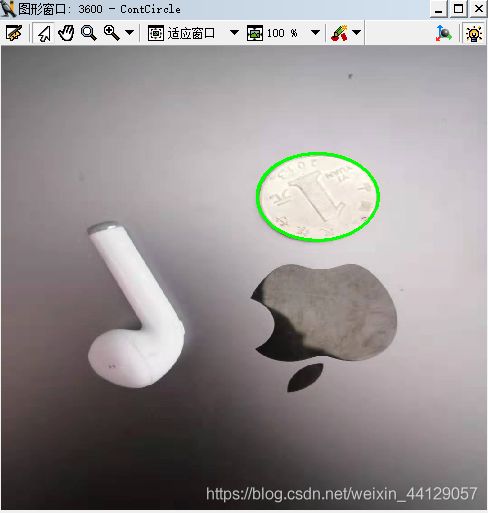
使用area_center (RegionDilation, Area, Row1, Column1)可以算出圆的面积Area,中心点坐标Row和Column,在变量窗口中显示。

完整代码:
read_image (Image, 'C:/Users/hwx/Desktop/tran1.jpg')
threshold (Image, Regions, 225, 255)
connection (Regions, ConnectedRegions)
select_shape (ConnectedRegions, SelectedRegions, 'area', 'and', 36916, 48635)
dilation_circle (SelectedRegions, RegionDilation, 7)
count_obj (RegionDilation, Number)
gen_contour_region_xld (RegionDilation, Contours, 'center')
fit_circle_contour_xld (Contours, 'algebraic', -1, 0, 0, 3, 2, Row, Column, Radius, StartPhi, EndPhi, PointOrder)
gen_circle_contour_xld (ContCircle, Row, Column, Radius, 0, 6.28318, 'positive', 1)
area_center (RegionDilation, Area, Row1, Column1)
re :=sqrt(Area/3.14)
dev_set_color ('green')
dev_set_line_width (3)
dev_clear_window ()
dev_display (Image)
dev_display (ContCircle)