Pandas(六)——缺失数据(Missing Data)
Pandas(六)——缺失数据(Missing Data)
- 思维导图
- 基本概念
-
- 缺失值的分类
- 数据值的处理方法
- Series与DataFrame
- 缺失观测及其类型
-
- 了解缺失信息
- 三种缺失符号
- Nullable类型与NA符号
- 缺失数据的运算与分组
-
- 加号与乘号规则
- groupby方法中的缺失值
- 填充与剔除
-
- fillna方法
- dropna方法
- 插值(interpolation)
-
- 线面插值
- 高级插值方法
- interpolate中的限制参数
思维导图
基本概念
缺失值的分类
按照数据缺失机制可分为:
- 可忽略的缺失
- 完全随机缺失(missing completely at random, MCAR)
- 所缺失的数据发生的概率既与已观察到的数据无关,也与未观察到的数据无关.
- 随机缺失(missing at random, MAR)
- 假设缺失数据发生的概率与所观察到的变量是有关的,而与未观察到的数据的特征是无关的.
- 完全随机缺失(missing completely at random, MCAR)
- 不可忽略的缺失(non-ignorable missing ,NIM) 或 非随机缺失(not missing at random, NMAR, or, missing not at random, MNAR)
- 如果不完全变量中数据的缺失既依赖于完全变量又依赖于不完全变量本身,这种缺失即为不可忽略的缺失.
【注意】:Panda读取的数值型数据,缺失数据显示**“NaN”**(not a number)。
数据值的处理方法
主要就是两种方法:
①删除存在缺失值的个案;
②缺失值插补;
【注意】缺失值的插补只能用于客观数据。由于主观数据受人的影响,其所涉及的真实值不能保证。
- 1、删除含有缺失值的个案(2种方法)
- (1)简单删除法
- 简单删除法是对缺失值进行处理的最原始方法。
- 它将存在缺失值的个案删除。
- 如果数据缺失问题可以通过简单的删除小部分样本来达到目标,那么这个方法是最有效的。
- (2)权重法
- 当缺失值的类型为非完全随机缺失的时候,可以通过对完整的数据加权来减小偏差。
- 把数据不完全的个案标记后,将完整的数据个案赋予不同的权重,个案的权重可以通过logistic或probit回归求得。
- 如果解释变量中存在对权重估计起决定行因素的变量,那么这种方法可以有效减小偏差。
- 如果解释变量和权重并不相关,它并不能减小偏差。
- 对于存在多个属性缺失的情况,就需要对不同属性的缺失组合赋不同的权重,这将大大增加计算的难度,降低预测的准确性,这时权重法并不理想。
- (1)简单删除法
- 2、可能值插补缺失值
【思想来源】:以最可能的值来插补缺失值比全部删除不完全样本所产生的信息丢失要少。
- (1)均值插补
- 属于单值插补。
- 数据的属性分为定距型和非定距型。
- 如果缺失值是定距型的,就以该属性存在值的平均值来插补缺失的值;
- 如果缺失值是非定距型的,就用该属性的众数来补齐缺失的值。
- (2)利用同类均值插补
- 属于单值插补。
- 用层次聚类模型预测缺失变量的类型,再以该类型的均值插补。
- 假设X= (X1,X2, … ,Xp)为信息完全的变量,Y为存在缺失值的变量,那么首先对X或其子集行聚类,然后按缺失个案所属类来插补不同类的均值。
- 如果在以后统计分析中还需以引入的解释变量和Y做分析,那么这种插补方法将在模型中引入自相关,给分析造成障碍。
- (3)极大似然估计(Max Likelihood ,ML)
- 在缺失类型为随机缺失的条件下,假设模型对于完整的样本是正确的,那么通过观测数据的边际分布可以对未知参数进行极大似然估计(Little and Rubin)。
- 这种方法也被称为忽略缺失值的极大似然估计,对于极大似然的参数估计实际中常采用的计算方法是期望值最大化(Expectation Maximization,EM)。
- 该方法比删除个案和单值插补更有吸引力,
- 重要前提:适用于大样本
- 有效样本的数量足够以保证ML估计值是渐近无偏的并服从正态分布。
- 这种方法可能会陷入局部极值,收敛速度也不是很快,并且计算很复杂。
- (4)多重插补(Multiple Imputation,MI)
- 多值插补的思想来源于贝叶斯估计,认为待插补的值是随机的,它的值来自于已观测到的值。
- 具体实践上通常是估计出待插补的值,然后再加上不同的噪声,形成多组可选插补值。
- 根据某种选择依据,选取最合适的插补值。
【多重插补方法的三个步骤】:
- 为每个空值产生一套可能的插补值,这些值反映了无响应模型的不确定性;每个值都可以被用来插补数据集中的缺失值,产生若干个完整数据集合。
- 每个插补数据集合都用针对完整数据集的统计方法进行统计分析。
- 对来自各个插补数据集的结果,根据评分函数进行选择,产生最终的插补值。
【多重插补方法举例】:
假设一组数据,包括三个变量Y1,Y2,Y3,它们的联合分布为正态分布,将这组数据处理成三组,A组保持原始数据,B组仅缺失Y3,C组缺失Y1和Y2。在多值插补时,对A组将不进行任何处理,对B组产生Y3的一组估计值(作Y3关于Y1,Y2的回归),对C组作产生Y1和Y2的一组成对估计值(作Y1,Y2关于Y3的回归)。
当用多值插补时,对A组将不进行处理,对B、C组将完整的样本随机抽取形成为m组(m为可选择的m组插补值),每组个案数只要能够有效估计参数就可以了。对存在缺失值的属性的分布作出估计,然后基于这m组观测值,对于这m组样本分别产生关于参数的m组估计值,给出相应的预测即,这时采用的估计方法为极大似然法,在计算机中具体的实现算法为期望最大化法(EM)。对B组估计出一组Y3的值,对C将利用 Y1,Y2,Y3它们的联合分布为正态分布这一前提,估计出一组(Y1,Y2)。
上例中假定了Y1,Y2,Y3的联合分布为正态分布。这个假设是人为的,但是已经通过验证(Graham和Schafer于1999),非正态联合分布的变量,在这个假定下仍然可以估计到很接近真实值的结果。
【多重插补弥补贝叶斯估计的不足之处】:
- 贝叶斯估计以极大似然的方法估计,极大似然的方法要求模型的形式必须准确,如果参数形式不正确,将得到错误得结论,即先验分布将影响后验分布的准确性。而多重插补所依据的是大样本渐近完整的数据的理论,在数据挖掘中的数据量都很大,先验分布将极小的影响结果,所以先验分布的对结果的影响不大。
- 贝叶斯估计仅要求知道未知参数的先验分布,没有利用与参数的关系。而多重插补对参数的联合分布作出了估计,利用了参数间的相互关系。
Series与DataFrame
- 区别:
- Series,只是一个一维数据结构,它由index和value组成。
- DataFrame,是一个二维结构,除了拥有index和value之外,还拥有column。
- 联系:
- dataframe由多个series组成,无论是行还是列,单独拆分出来都是一个series。
缺失观测及其类型
【Pandas读取数据】:
import numpy as np
import pands as pd
#读取一个csv文件,读取其它类型文件,详见Pandas基础
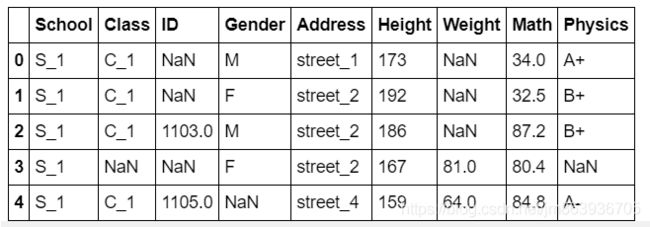
df = pd.read_csv('data/table_missing.csv')
df.head()
了解缺失信息
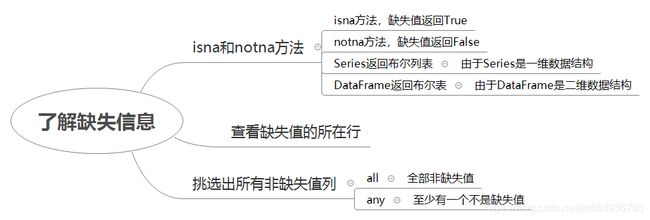
#对Series使用isna方法
df['Physics'].isna().head()

#对Series使用notna方法
df['Physics'].notna().head()

#对DataFrame使用isna方法
df.isna().head()

#对DataFrame使用notna方法
df.notna().head()

#求DataFrame每列的缺失值的数量
df.isna().sum()

#通过info函数查看缺失信息
df.info()

#查看缺失值所在行,以最后一列为例,挑出该列缺失值的行
df[df['Physics'].isna()]

#挑选出所有非缺失值的列
df[df.notna().all(1)]
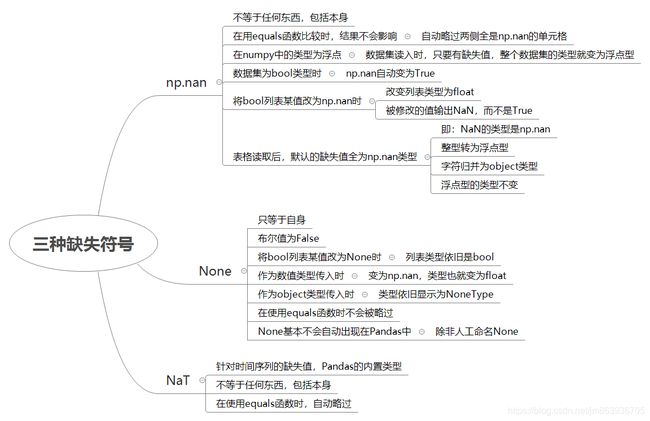
三种缺失符号
Nullable类型与NA符号
- Nullable整型:
对于该种类型,它与 i n t int int在符号上的差别在于首字母大写: I n t Int Int
s_original = pd.Series([1,2],dtype="int64")
s_original
'''
输出:
0	1
1	2
dtype:int64
'''
s_new = pd.Series([1,2],dtype="Int64")
s_new
'''
输出:
0	1
1	2
dtype:Int64
'''
好处/优点:
前面提到的三种缺失值(np.na、None、NaT)都会被替换为统一的NA符号,且不改变数据类型。
s_original[1] = np.nan
s_original
'''
output:
0	1.0
1	NaN
dtype:float64
'''

s_new[1] = np.nan
s_new
'''
output:
0	1
1
dtype:Int64
'''

s_new[1] = None
s_new
'''
output:
0	1
1
dtype:Int64
'''

s_new[1] = pd.NaT
s_new
'''
output:
0	1
1
dtype:Int64
'''
- Nullable布尔型:
对于该种类型,符号为boolean,作用与上面类似。
s_original = pd.Series([1,0],dtype="bool")
s_original
'''
output:
0	True
1	False
dtype:bool
'''

s_new = pd.Series([1,0],dtype="boolean")
s_new
'''
output:
0	True
1	False
dtype:boolean
'''

s_original[0] = np.nan
s_original
'''
output:
0	NaN
1	0.0
dtype:float64
'''

s_original = pd.Series([1,0],dtype="bool")
s_original[0] = None
s_original
'''
output:
0	False
1	False
dtype:bool
'''

s_new[0] = np.nan
s_new
'''
output:
0
1	True
dtype:boolean
'''

s_new[0] = None
s_new
'''
output:
0
1	True
dtype:boolean
'''

s_new[0] = pd.NaT
s_new
'''
output:
0
1	True
dtype:boolean
'''

s = pd.Series(['dog','cat'])
s[s_new]
'''
output:
1	cat
dtype:object
'''
- string类型:
【注意】:此处简要讲解,详见Pandas(七)
本质上属于Nullable类型,不会因为含有缺失而改变类型
s = pd.Series(['dog','cat'],dtype='string')
s
'''
output:
0	dog
1	cat
dtype:string
'''

s[0] = np.nan
#s[0] = None
#s[0] = pd.NaT
'''
output:
0
1	cat
dtype:string
'''
【与object类型的区别】:
在调用字符方法后,string类型返回的是Nullable类型,object则会根据缺失类型和数据类型而改变
s = pd.Series(["a",None,"b"],dtype="string")
s.str.count('a')
'''
output:
0	1
1
2	0
dtype:Int64
'''

s2 = pd.Series(["a",None,"b"],dtype="object")
s2.str.count("a")
'''
output:
0	1.0
1	NaN
2	0.0
dtype:float64
'''

s.str.isdigit()
'''
output:
0	False
1
2	False
dtype:boolean
'''

s2.str.isdigit()
'''
output:
0	False
1	None
2 	False
dtype:object
'''
- NA的特性:
- 逻辑运算
只需看该逻辑运算的结果是否依赖pd.NA的取值,如果依赖,则结果还是NA,如果不依赖,则直接计算结果。
取值不明,直接报错。 - 算数运算和比较运算
只需记住除了以下两类情况,其它情况都是NA。
- 逻辑运算
pd.NA ** 0
'''
output:1
'''

1 ** pd.NA
'''
output:1
'''
- convert_dtypes方法
【函数功能】:在读取数据时,就把数据列转为Nullable类型。
缺失数据的运算与分组
加号与乘号规则
- 使用加法时,缺失值为0
s = pd.Series([2,3,np.nan,4])
s.sum()
'''
output:9.0
'''
- 使用乘法时,缺失值为1
s.prod()
'''
output:24.0
'''
- 使用累计函数时,缺失值自动略过
s.cumsum()
'''
output:
0	2.0
1	5.0
2	NaN
3	9.0
dtype:float64
'''

s.cumprod()
'''
output:
0	2.0
1	6.0
2	NaN
3	24.0
dtype:float64
'''

s.pct_change()
'''
output:
0	NaN
1	0.500000
2	0.000000
3	24.0
dtype:float64
'''
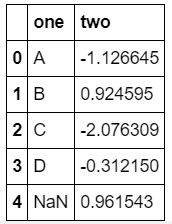
groupby方法中的缺失值
自动忽略为缺失值的组
df_g = pd.DataFrame({
     'one':['A','B','C','D',np.nan],'two':np.random.randon(5)})
df_g
df_g.groupby('one').groups
'''
output:
{'A': Int64Index([0], dtype='int64'),
 'B': Int64Index([1], dtype='int64'),
 'C': Int64Index([2], dtype='int64'),
 'D': Int64Index([3], dtype='int64')}
'''
填充与剔除
fillna方法
- 值填充
df['Physics'].fillna('missing').head()
'''
output:
0         A+
1         B+
2         B+
3    missing
4         A-
Name: Physics, dtype: object
'''
- 前项填充(填充缺失值前一个项的值)
df['Physics'].fillna(method='ffill').head()
'''
output:
0    A+
1    B+
2    B+
3    B+
4    A-
Name: Physics, dtype: object
'''
- 后项填充(填充缺失值后一个项的值)
df['Physics'].fillna(method='backfill').head()
'''
output:
0    A+
1    B+
2    B+
3    A-
4    A-
Name: Physics, dtype: object
'''
- 填充中的对称性
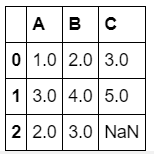
df_f = pd.DataFrame({
     'A':[1,3,np.nan],'B':[2,4,np.nan],'C':[3,5,np.nan]})
df_f.fillna(df_f.mean())
[output]
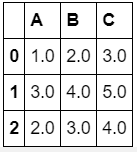
返回的结果中没有C,根据对齐特点不会被填充
df_f.fillna(df_f.mean()[['A','B']])
dropna方法
df_d = pd.DataFrame({
     'A':[np.nan,np.nan,np.nan],'B':[np.nan,3,2],'C':[3,2,1]})
df_d
- axis参数
(1)axis=0,删除存在缺失值的行
df_d.dropna(axis=0)
(2)axis=1,删除存在缺失值的列
df_d.dropna(axis=1)
- how参数(可以选all或any)
(1)选择all,表示全为缺失去除。当某一行/列(由axis决定)的值全部都为缺失值的时候,才被删除。
df_d.dropna(axis=1,how='all')
(2)选择any,表示存在缺失去除。当某一行/列(由axis决定)的值至少有一个缺失值的时候,才被删除。
3. subset参数(即在某一组列范围中搜索缺失值)
df_d.dropna(axis=0,subset=['B','C'])
插值(interpolation)
线面插值
- 索引无关的线性插值
默认状态下,interpolate会对缺失的值进行线性插值。
此时的插值与索引无关
s = pd.Series([1,10,15,-5,-2,np.nan,np.nan,28])
s
'''
output:
0     1.0
1    10.0
2    15.0
3    -5.0
4    -2.0
5     NaN
6     NaN
7    28.0
dtype: float64
'''

s.interpolate()
'''
output:
0     1.0
1    10.0
2    15.0
3    -5.0
4    -2.0
5     8.0
6    18.0
7    28.0
dtype: float64
'''

s.index = np.sort(np.random.randint(50,300,8))
s.interpolate()
'''
值不变
output:
69      1.0
71     10.0
84     15.0
117    -5.0
119    -2.0
171     8.0
219    18.0
236    28.0
dtype: float64
'''
- 与索引有关的插值
method中的index和time选项可以使插值线性地依赖索引,即插值为索引的线性函数。
如果索引是时间,那么可以按照时间长短插值。
高级插值方法
此处的高级指的是与线性插值相比较,例如样条插值、多项式插值、阿基玛插值等。
此处属于数值分析的内容。
interpolate中的限制参数
- limit表示最多插入多少个
s = pd.Series([1,np.nan,np.nan,np.nan,5])
s.interpolate(limit=2)
'''
output:
0    1.0
1    2.0
2    3.0
3    NaN
4    5.0
dtype: float64
'''
- limit_direction表示插值方向,可选forward,backward,both,默认前向
s = pd.Series([np.nan,np.nan,1,np.nan,np.nan,np.nan,5,np.nan,np.nan,])
s.interpolate(limit_direction='backward')
'''
output:
0    1.0
1    1.0
2    1.0
3    2.0
4    3.0
5    4.0
6    5.0
7    NaN
8    NaN
dtype: float64
'''
- limit_area表示插值区域,可选inside,outside,默认None
s = pd.Series([np.nan,np.nan,1,np.nan,np.nan,np.nan,5,np.nan,np.nan,])
s.interpolate(limit_area='inside')
'''
output:
0    NaN
1    NaN
2    1.0
3    2.0
4    3.0
5    4.0
6    5.0
7    NaN
8    NaN
dtype: float64
'''

s = pd.Series([np.nan,np.nan,1,np.nan,np.nan,np.nan,5,np.nan,np.nan,])
s.interpolate(limit_area='outside')
'''
0    NaN
1    NaN
2    1.0
3    NaN
4    NaN
5    NaN
6    5.0
7    5.0
8    5.0
dtype: float64
'''

