人工智能 实验1.线性回归,机器学习库使用
一、实验目的
熟悉Python语言环境,了解并学习机器学习相关库的使用。
二、实验内容
1、python环境安装
(1)首先安装 Python3(3.5或3.6)。因为后面会用到科学计算和机器学习软件包,所以建议安装 Anaconda。这是一个可用于 Linux、OS X 和 Windows 上的工业级的 Python 实现,完整包含了机器学习所需的软件包。
- 按下 Windows 徽标键,调出 Windows 开始菜单,可以看到 “最近添加”的:Anaconda3(64-bit)
- Anaconda Navigator
- Anaconda Prompt
- Jupyter Notebook
- Reset Spyder Settings
- Spyder
点击 Anaconda Navigator ,第一次启用,会初始化,耐心等待一段时间,加载完成,界面如图。
我们点击 jupyterlab 下面的 Launch ,会在默认浏览器(我这里是 Chrome)打开 http://localhost:8888/lab 这样一个东东,这里就可以输入 Python 代码啦,来一句 Hello World 吧。
我们可以打开 Anaconda Navigator -> Launch jupyterlab ,也可以直接在浏览器输入 http://localhost:8888/lab (可以保存为书签)。如果是布置在云端,可以输入服务器域名(IP),
(2)安装spyder或其他python开发环境.
Pip环境spyder安装
https://blog.csdn.net/weixin_35732969/article/details/83790166
https://blog.csdn.net/BurneAris/article/details/75214976
anaconda环境下spyder安装
https://blog.csdn.net/qq_36556893/article/details/79435749
2、安装正确测试
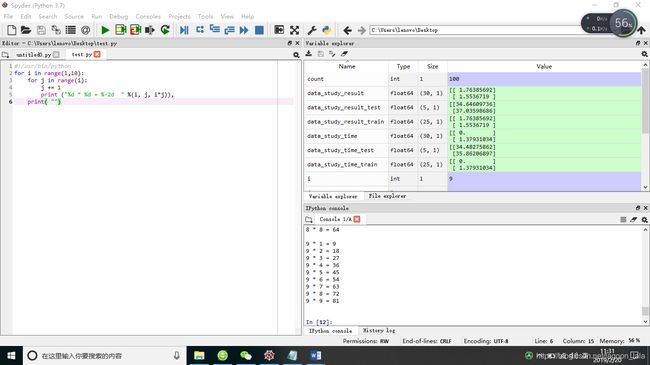
打开spyder
测试运行下列代码(打印乘法表):
#!/usr/bin/python
for i in range(1,10):
for j in range(i):
j += 1
print ("%d * %d = %-2d " %(i, j, i*j)),
print("")
结果如下:
3、机器学习库的应用练习
假设学习时间和学习成果之间的关系如下所示,建立线性回归模型,进行误差分析并绘图。
部分代码如下:
import numpy as np
import matplotlib.pyplot as plt
from sklearn.linear_model import LinearRegression
study_time = np.linspace(start=0, stop=40, num=30) # 创建学习时间数据
study_result = np.linspace(start=0, stop=40, num=30) + 3*np.random.rand(30) # 创建学习成果数据
# 学习时间和学习结果之间的关系如下图所示:
study = plt.figure(figsize=(10, 8)) # 设置画布大小
ax1 = study.add_subplot(111)
ax1.set_title("study and result") # 设置标题
plt.xlabel("study_time") # 设置横坐标名称
plt.ylabel("study_result") # 设置纵坐标名称
plt.scatter(study_time, study_result) # 画出散点图
plt.show() # 展示图片
#模型训练
model = LinearRegression() #线性回归
# 数据处理
data_study_time = study_time.reshape(-1, 1) #转换成1列数据
data_study_result = study_result.reshape(-1, 1)
# 分割数据集为训练数据和测试数据
data_study_time_train, data_study_time_test = data_study_time[:25], data_study_time[25:]
data_study_result_train, data_study_result_test = data_study_result[:25], data_study_result[25:]
# 模型训练
model.fit(data_study_time_train, data_study_result_train)
# 线性回归分析绘图
补充代码
# 误差计算并显示
补充代码
四、实验要求:
1、生成40个数据,设定训练数据为30个,测试数据为10个
2、补充上面程序中的代码
4、撰写实验报告(电子版即可)
linspace
指定开始值、终值和生成个数创建一维等差数组,但其数组中不包含终值
在默认情况下,linspace函数可以生成元素为50的等间隔数列。而前两个参数分别是数列的开头与结尾。如果写入第三个参数,可以制定数列的元素个数
通过 print(help(np.linspace)) 来查看linspace() 函数
np.linspace(start=0, stop=40, num=30)生成30个元素的等间隔数组
np.random.rand(30) 生成30个元素的随机数数组
数组可相加
LinearRegression
in module sklearn.linear_model.base
reshape
可以重新调整矩阵的行数、列数、维数。
如B = reshape((2,4))为2行4列
数组新的shape属性应该要与原来的配套,如果等于-1的话,那么Numpy会根据剩下的维度计算出数组的另外一个shape属性值。如.reshape(-1, 1):
想让z变成只有1列,行数不知道多少
通过reshape生成的新数组和原始数组公用一个内存,也就是说,假如更改一个数组的元素,另一个数组也将发生改变。
model.fit
拟合模型:
model.fit(data_study_time_train, data_study_result_train)
model.intercept_#取出model中的截距
model.coef_#斜率
plt.scatter
散点图
plt.scatter(x,y,s=area,c=colors,alpha=0.5)
model.predict
预测model.predict(data_study_time_test)预测与训练集不能完全相同
plt.plot
线图
plt.plot(x,y)
#坐标轴
plt.xlabel('study_time')
plt.ylabel('study_result')
plt.legend(loc=2)#将多个图例放在一起
plt.show()
误差计算
format(sum(np.square(model.predict(data_study_time_test)-data_study_result_test)))
(预测值-实际值)^2
实验代码
import numpy as np
import matplotlib.pyplot as plt
from sklearn.linear_model import LinearRegression


study_time = np.linspace(start=0, stop=40, num=30)  # 创建学习时间数据/
study_result = np.linspace(start=0, stop=40, num=30) + 3*np.random.rand(30)  # 创建学习成果数据
# 学习时间和学习结果之间的关系如下图所示:
study = plt.figure(figsize=(10, 8))  # 设置画布大小
ax1 = study.add_subplot(111)
ax1.set_title("study and result")  # 设置标题
plt.xlabel("study_time")  # 设置横坐标名称
plt.ylabel("study_result")  # 设置纵坐标名称
plt.scatter(study_time, study_result)  # 画出散点图
plt.show()  # 展示图片

#模型训练
model = LinearRegression()   #线性回归
#help(LinearRegression)
#print(model);
# 数据处理
data_study_time = study_time.reshape(-1, 1)  #转换成1列数据
data_study_result = study_result.reshape(-1, 1)
#print(data_study_result)
# 分割数据集为训练数据和测试数据
data_study_time_train, data_study_time_test = data_study_time[:15], data_study_time[15:]
data_study_result_train, data_study_result_test = data_study_result[:15], data_study_result[15:]
# 模型训练
model.fit(data_study_time_train, data_study_result_train)
# 线性回归分析绘图
a=model.intercept_#取出model中的截距
b=model.coef_#斜率
print('模型的回归方程是:y=%f+%f x'%(a,b))

#绘制拟合散点图
plt.scatter(data_study_time_train,data_study_result_train,color='b',label='train data')
test_y_pred=model.predict(data_study_time_test)
plt.plot(data_study_time_test,test_y_pred,color='black',label='best line')
#测试集数据的散点图
plt.scatter(data_study_time_test,data_study_result_test,color='r',label='test data')
#坐标轴
plt.xlabel('study_time')
plt.ylabel('study_result')
plt.legend(loc=2)#将多个图例放在一起
plt.show()


