PySpark机器学习案例--分类与聚类
案例一:基于逻辑回归算法的机器学习(分类)
要求:text含有“spark”的 lable 标记为1,否则标记为0
训练数据集:
# 训练数据
id	text	 		label
0	"a b c d e spark"	1.0
1	"b d"			0.0
2	"spark f g h"		1.0
3	"hadoop mapreduce"	0.0
测试数据集:
# 测试数据
id	text
4	"spark i j k"
5	"l m n"
6	"spark hadoop spark"
7	"apache hadoop"
可以看到:
训练数据集包含有id,text,label三个字段;
测试数据集只有id,text两个字段,没有的label字段就是要我们用机器学习方法预测出来的值,具体方式如下:
1.用训练数据通过逻辑回归算法,训练出模型(经验)
2. 测试数据经过模型处理得到预测值

完整代码:
example1.py
from pyspark.ml import Pipeline
from pyspark.ml.classification import LogisticRegression
from pyspark.ml.feature import HashingTF, Tokenizer
from pyspark.sql import SparkSession
spark = SparkSession.builder.getOrCreate()

# 程序实现识别文本行中是否包含spark,如果包含标记列为1,否则为0

# 训练数据集
# Prepare training documents from a list of (id, text, label) tuples.
training = spark.createDataFrame([
    (0, "a b c d e spark", 1.0),
    (1, "b d", 0.0),
    (2, "spark f g h", 1.0),
    (3, "hadoop mapreduce", 0.0)
], ["id", "text", "label"])

# 配置一个pipeline管道,包括转换器和评估器
# Configure an ML pipeline, which consists of three stages: tokenizer, hashingTF, and lr.
tokenizer = Tokenizer(inputCol="text", outputCol="words")
hashingTF = HashingTF(inputCol=tokenizer.getOutputCol(), outputCol="features")
lr = LogisticRegression(maxIter=10, regParam=0.001)
pipeline = Pipeline(stages=[tokenizer, hashingTF, lr])

# 用管道训练出模型
# Fit the pipeline to training documents.
model = pipeline.fit(training)

# 测试数据,测试数据没有label标签
# Prepare test documents, which are unlabeled (id, text) tuples.
test = spark.createDataFrame([
    (4, "spark i j k"),
    (5, "l m n"),
    (6, "spark hadoop spark"),
    (7, "apache hadoop")
], ["id", "text"])

# 用测试数据来预测,
# Make predictions on test documents and print columns of interest.
prediction = model.transform(test)
# 打印出感兴趣的列
selected = prediction.select("id", "text", "probability", "prediction")
for row in selected.collect():
    rid, text, prob, prediction = row
    print("(%d, %s) --> prob=%s, prediction=%f" % (rid, text, str(prob), prediction))
注意:运行该项目需要先安装numpy
运行方法:
至少有3种运行方式
1. 如果是linux终端下运行,则输入以下命令运行(推荐使用)
$ spark-submit example1.py或者
$ python3 example1.py2. 如果是在pycharm里编程,配置好spark相关文件后,则直接右键运行
3. 如果是在pyspark命令行下,那么就逐行输入,依次运行,需要点耐心和细心。
运行结果:
(4, spark i j k) --> prob=[0.1596407738787475,0.8403592261212525], prediction=1.000000
(5, l m n) --> prob=[0.8378325685476744,0.16216743145232562], prediction=0.000000
(6, spark hadoop spark) --> prob=[0.06926633132976037,0.9307336686702395], prediction=1.000000
(7, apache hadoop) --> prob=[0.9821575333444218,0.01784246665557808], prediction=0.000000
从运行结果来看,符合我们的预期,即包含spark的行预测值为1,否者为0。
案例二:基于K-Means算法的机器学习案例(聚类)
要求:对空间中的6个点进行K-Means聚类分析,K=2,得到2个中心点坐标
数据集的数据格式为支持向量机数据(libsvm),如下:
id Feature
0 1:0.0 2:0.0 3:0.0
1 1:0.1 2:0.1 3:0.1
2 1:0.2 2:0.2 3:0.2
3 1:9.0 2:9.0 3:9.0
4 1:9.1 2:9.1 3:9.1
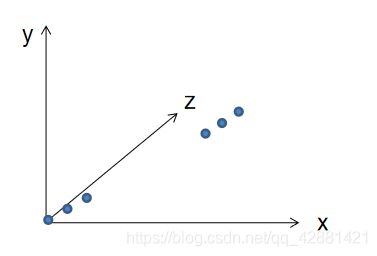
5 1:9.2 2:9.2 3:9.2从数据集可以画出三维坐标轴中的6个点
预想的结果是通过数据集训练出一个模型,这个模型可以自动找出2个簇的中心点坐标,如下:

完整代码:
example2.py
from pyspark.ml.clustering import KMeans
from pyspark.ml.evaluation import ClusteringEvaluator

from pyspark.sql import SparkSession
spark = SparkSession.builder.getOrCreate()

# 程序主要完成对空间点的聚类,6个空间点x,y,z坐标如下
# 0 1:0.0 2:0.0 3:0.0
# 1 1:0.1 2:0.1 3:0.1
# 2 1:0.2 2:0.2 3:0.2
# 3 1:9.0 2:9.0 3:9.0
# 4 1:9.1 2:9.1 3:9.1
# 5 1:9.2 2:9.2 3:9.2

# Loads data. 注意修改txt文件路径
dataset = spark.read.format("libsvm").load("data.txt")

# 训练一个kmeans模型,将K设置为2,将分为两个簇
kmeans = KMeans().setK(2).setSeed(1)
model = kmeans.fit(dataset)

# 预测 Make predictions
predictions = model.transform(dataset)

# 评估:创建评估器对象及评估 Evaluate clustering by computing Silhouette score
evaluator = ClusteringEvaluator()

silhouette = evaluator.evaluate(predictions)
print("Silhouette with squared euclidean distance = " + str(silhouette))

# 打印中心点Shows the result.
centers = model.clusterCenters()
print("Cluster Centers: ")
for center in centers:
    print(center)
准备数据
$ nano data.txt内容如下:
0 1:0.0 2:0.0 3:0.0
1 1:0.1 2:0.1 3:0.1
2 1:0.2 2:0.2 3:0.2
3 1:9.0 2:9.0 3:9.0
4 1:9.1 2:9.1 3:9.1
5 1:9.2 2:9.2 3:9.2
运行
$ spark-submit example2.py结果:
Silhouette with squared euclidean distance = 0.9997530305375207
Cluster Centers:
[0.1 0.1 0.1]
[9.1 9.1 9.1]
完成!enjoy it!