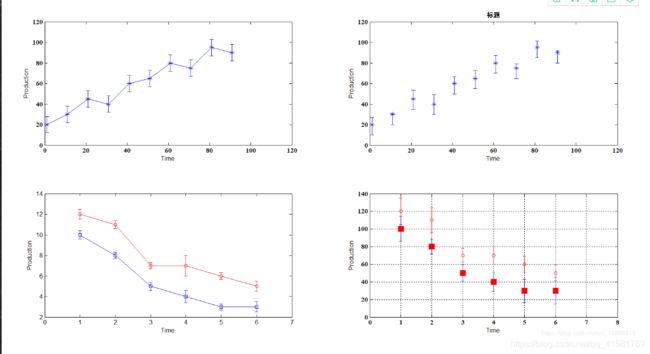
set(0,'defaultfigurecolor','w')

%errorbar函数实例
figure;
subplot(2,2,1);
%横轴
x = 1:10:100;
%均值
y = [20 30 45 40 60 65 80 75 95 90];
%标准差
err = 8*ones(size(y));
%线型,颜色,线宽,标记大小
errorbar(x,y,err,'-*b','LineWidth',1','MarkerSize',8)
xlabel('Time');ylabel('Production');
%设置坐标轴字体大小粗细,字体样式以及横纵轴范围
set(gca,'fontsize',10,'fontweight','bold','FontName','Times New Roman','XLim',[0,120],'YLim',[0,120]);

subplot(2,2,2);
x = 1:10:100;
y = [20 30 45 40 60 65 80 75 95 90];
err1 = 10*ones(size(y));
err2 = 10*rand(size(y));
errorbar(x,y,err1,err2,'*b','LineWidth',1','MarkerSize',8)
xlabel('Time');ylabel('Production');
title('标题','fontsize',10,'fontweight','bold');
%设置坐标轴字体大小粗细,字体样式以及横纵轴范围
set(gca,'fontsize',10,'fontweight','bold','FontName','Times New Roman','XLim',[0,120],'YLim',[0,120]);

subplot(2,2,3)
Average1=[12,11,7,7,6,5];
Variance1=[0.5,0.4,0.3,1,0.3,0.5];     %A地的数据
Average2=[10,8,5,4,3,3];
Variance2=[0.4,0.3,0.4,0.6,0.3,0.5];    %B地的数据
Time=1:1:6;
errorbar(Time,Average1,Variance1,'r-o')    %A地误差棒图,用红色线表示
hold on
errorbar(Time,Average2,Variance2,'b-s')    %B地误差棒图,用蓝色线表示
xlabel('Time');ylabel('Production');

subplot(2,2,4);
Average2=[120,110,70,70,60,50];
Variance2=[15,14,8,10,9,9];     %A地的数据
Average3=[100,80,50,40,30,30];
Variance3=[14,8.3,9.4,10.6,13,15];    %B地的数据
Time=1:1:6;
errorbar(Time,Average2,Variance2,'ro')    %A地误差棒图,用红色线表示
hold on
errorbar(Time,Average3,Variance3,'bs','MarkerSize',10,...
    'MarkerEdgeColor','red','MarkerFaceColor','red')    %B地误差棒图,用蓝色线表示
xlabel('Time');ylabel('Production');
set(gca,'fontsize',10,'fontweight','bold','FontName','Times New Roman','XLim',[0,8],'YLim',[0,140]);
grid on;
