matplotlib入门-条形图
条形图是日常画图中最常使用的图形之一
简单模板
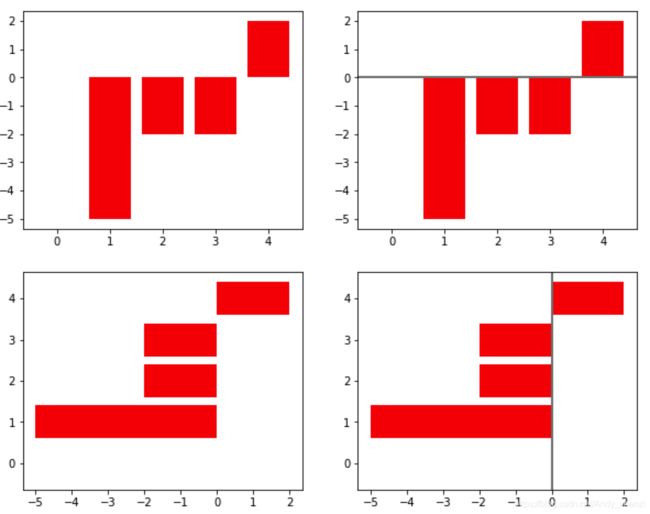
首先看一个简单的模板,条形图一般分为竖向和横向两种,如果图中有负数的话,最好画一条横线或者竖线,可以让图看起来更加完整和美观,如下:
plt.figure(figsize=(10,8))

#正常柱形图
plt.subplot(221)
plt.bar(x,y,color='red')

#正常柱形图,x=0处加横线
plt.subplot(222)
plt.bar(x,y,color='red')
plt.axhline(0,color='grey',linewidth=2)

#横向条形图
plt.subplot(223)
plt.barh(x,y,color='red')

#横向条形图,y=0处加横线
plt.subplot(224)
plt.barh(x,y,color='red')
plt.axvline(0,color='grey',linewidth=2)
负数区分
当然如果图表中有负数的话,我们最好是用不同的颜色进行区分
v_bars = plt.bar(x,y,color='lightblue',alpha=0.6)
plt.axhline(0,color='grey',linewidth=2)
for bar,height in zip(v_bars,y):
    if height < 0:
        bar.set(edgecolor = 'darkred',color = 'green',linewidth = 3,alpha=0.6)
plt.show()
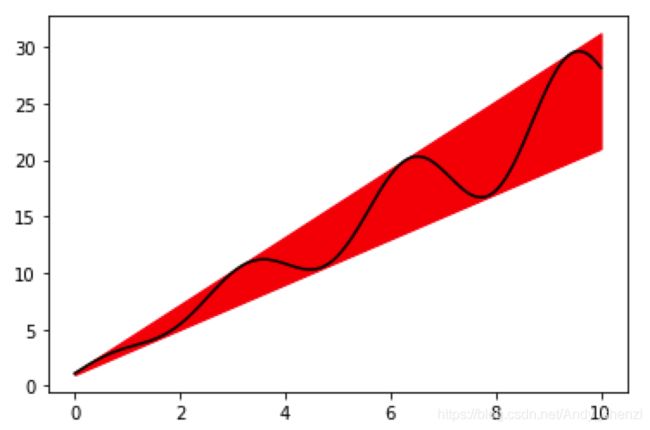
颜色填充
x = np.linspace(0,10,200)
y1 = 2*x +1
y2 = 3*x +1.2
y_mean = 0.5*x*np.cos(2*x) + 2.5*x +1.1
fig,ax = plt.subplots()
#设定填充位置
ax.fill_between(x,y1,y2,color='red')
ax.plot(x,y_mean,color='black')
plt.show()
查看数据差异
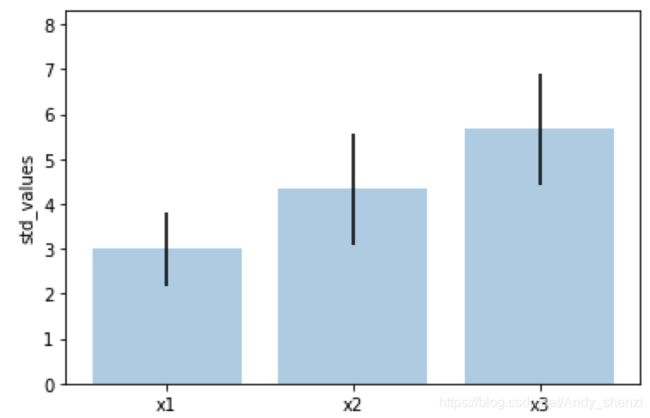
比如我们有三组数据,想看下每组数据的均值及方差情况
x1=[2,3,4]
x2=[3,4,6]
x3=[4,6,7]

mean_values=[np.mean(x1),np.mean(x2),np.mean(x3)]
std_values=[np.std(x1),np.std(x2),np.std(x3)]


bar_label = ['x1','x2','x3']

x_pos = list(range(len(bar_label)))
plt.bar(x_pos,mean_values,yerr=std_values,alpha=0.3)
max_y = max(zip(mean_values,std_values))
plt.ylim([0,(max_y[0]+max_y[1])*1.2])
plt.ylabel('std_values')
plt.xticks(x_pos,bar_label)
对比图
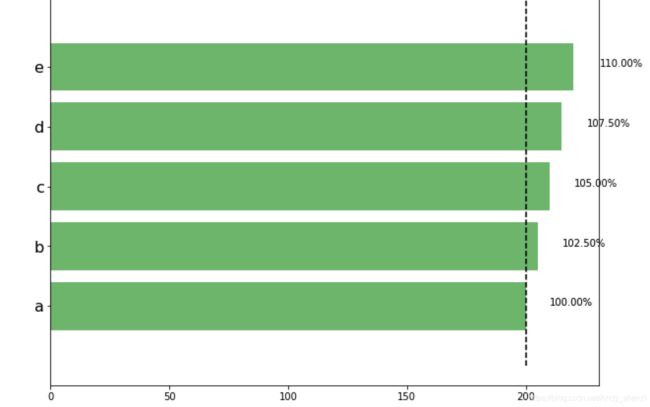
在一组数据中,我们以最小值为参照,显示其他组数据的增长变化情况
#构造数据
data = range(200, 225, 5)
#设定一个标签
bar_labels = ['a', 'b', 'c', 'd', 'e']

fig = plt.figure(figsize=(10,8))
#位置
y_pos = np.arange(len(data))
#基本图形
bars = plt.barh(y_pos,data,alpha = 0.5,color='g')
#y轴标签
plt.yticks(y_pos, bar_labels, fontsize=16)
#对比线
plt.vlines(min(data),-1,len(data)+0.5,linestyle = 'dashed')
#数据标签
for b,d in zip(bars,data):
    plt.text(b.get_width()+b.get_width()*0.05,b.get_y()+b.get_height()/2,'{0:.2%}'.format(d/min(data)))
plt.show()
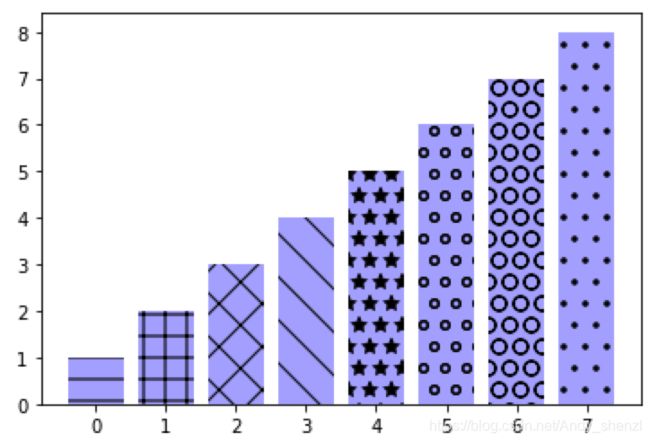
图形填充
#填充标示
patterns = ('-', '+', 'x', '\\', '*', 'o', 'O', '.')

fig = plt.gca()

mean_value = range(1,len(patterns)+1)
x_pos = list(range(len(mean_value)))

bars = plt.bar(x_pos,mean_value,color='b',alpha=0.3)

for bar,pattern in zip(bars,patterns):
    bar.set_hatch(pattern)
完整代码
