写了两篇 matplotlib, 感觉这个库里面,函数还真是有点多,,,不知何年何月给写完,或者半道撂翘子,,,算了,不管那么多,先把自己常用的写一写吧 ~
- 目录:
matplotlib 学习笔记(1): figure
matplotlib 学习笔记(2):plot
matplotlib 学习笔记(3): subplot and subplots
matplotlib 学习笔记(4):ion 和 ioff
matplotlib 学习笔记(5):scatter
seaborn 简单使用
subplot 函数
调用 subplot 函数后,如下所示,创建一个nrows 行,ncols 列的 Axes 对象,然后返回在 index 位置的子图。
subplot(nrows, ncols, index, facecolor, polar, **kwargs)
- nrows,ncols,index:如果这三个数都小于10,则可以连写,
2,2,2可以写为222。 - facecolor:string型,如 ‘b',’w' 等,设置子图的背景。
- polar:bool类型,默认为False,设置坐标是否为极坐标。
import matplotlib.pyplot as plt
import numpy as np

if __name__ == '__main__' :
    t1 = np.arange(0, 5, 0.1)
    t2 = np.arange(0, 5, 0.02)

    plt.figure(1)
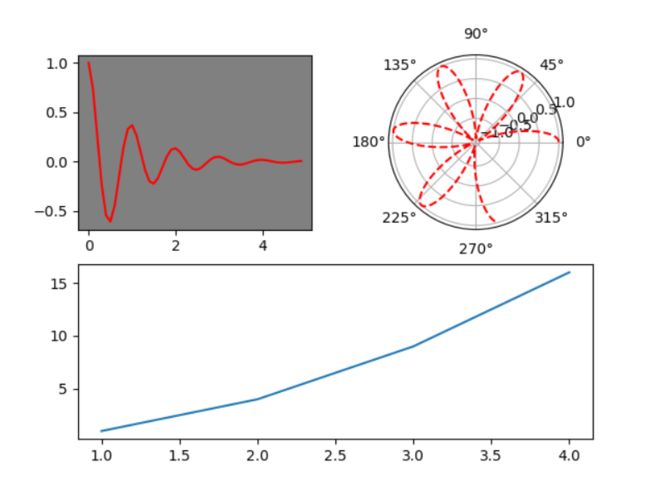
    plt.subplot(221,facecolor = 'gray')
    plt.plot(t1, np.exp(-t1) * np.cos(2 * np.pi * t1), 'r-')

    plt.subplot(222,polar = True)
    plt.plot(t2, np.cos(2 * np.pi * t2), 'r--')

    plt.subplot(212) #大家看这里,不再是前面的 ‘22‘,换成了’21‘,表示两行一列
    plt.plot([1, 2, 3, 4], [1, 4, 9, 16])

    plt.show()
当然,如果想要对子图操作更加严格,按照网格来画,可以选择使用 GridSpec 。import matplotlib.gridspec as gridspec,具体使用方法这里便不再展开 ~
subplots 函数
subplots 函数会返回一个figure 对象和一个 Axes 对象:
def subplots(nrows=1, ncols=1, sharex=False, sharey=False, squeeze=True,
             subplot_kw=None, gridspec_kw=None, **fig_kw):
- nrows and ncols:行和列的个数。
- sharex and sharey:决定是否共享x轴或y轴。
- **fig_kw:figure 函数的参数都可以,如 figsize、facecolor等。
    fig,axes = plt.subplots(2,2)

    axes[0,0].plot(t1, np.exp(-t1) * np.cos(2 * np.pi * t1), 'r-', label = 'line')
    axes[0, 0].locator_params(nbins=10)                               #控制x、y轴的标注位置,此处只用来控制标注个数
    axes[0, 0].set_xlabel('x-label', fontsize=fontsize)               #设置x轴的标签
    axes[0, 0].set_ylabel('y-label', fontsize=fontsize)               #设置y轴的标签
    axes[0, 0].set_title('Title', fontsize=fontsize)                  #设置该子图的标题
    axes[0, 0].legend()                                               #添加图例
    axes[0,1].plot(t2, np.cos(2 * np.pi * t2), 'r--')
    axes[1,1].plot([1, 2, 3, 4], [1, 4, 9, 16])
    plt.show()
稍加修饰
顺便再附带一个小命令plt.tight_layout(),可以解决各个子图标签、标题相互遮挡等问题。
plt.tight_layout(pad=0.4, w_pad=0.5, h_pad=1.0)
- pad:分数(相对于 font-size),控制各个子图边界或 figure 边界的内边距。
- h_pad and w_pad:单位为英寸,控制相邻子图的高或者宽的边距。
