Python之初识Matplotlib
图形绘制
在人工智能的实验中,图形的绘制和数据的可视化非常重要。
matplotlib
Matplotlib是用于绘制图形的库,使用Matplotlib可以轻松地绘制图形和实现数据的可视化。
from IPython.core.interactiveshell import InteractiveShell
InteractiveShell.ast_node_interactivity = "last_expr"#让全部结果都显示出来,因为每个cell只会显示最后一个输出结果,除非用print。
import matplotlib.pyplot as plt
year = [1950, 1970, 1990, 2010]      # 世界人口数据
pop = [2.519, 3.692, 5.263, 6.972]
plt.plot(year, pop)                  # 折线图
plt.show()
import matplotlib.pyplot as plt
year = [1950, 1970, 1990, 2010]      # 世界人口数据
pop = [2.519, 3.692, 5.263, 6.972]
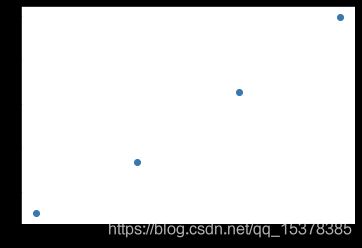
plt.scatter(year, pop)  # 散点图
plt.show()
plt.plot(year, pop)
plt.xlabel("year")                # 不能使用Unicode, "年"
plt.ylabel("population")          # 坐标轴标注
plt.title("world population")     # 标题
plt.yticks([0,2,4,6,8,10],
    ["0","2B","4B","6B","8B","10B"]) # 坐标轴刻度
plt.show()
plt.plot(year, pop)
plt.fill_between(year,pop,0,color='g') # 填充色
plt.xlabel("year")
plt.ylabel("population")
plt.title("world population")
plt.yticks([0,2,4,6,8,10],
    ["0","2B","4B","6B","8B","10B"])
plt.show()
直方图
直方图文档
values = [0,0.6,1.4,1.6,2.2,2.5,2.6,3.2,3.5,3.9,4.2,6]
plt.hist(values, bins=5)    # 分布区间数目
plt.show()
矩阵绘图:plt.imshow()
混淆矩阵
# 矩阵绘图
import numpy as np
m = np.random.rand(10,10)
# print(m)
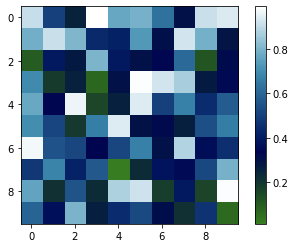
plt.imshow(m, interpolation='nearest',cmap=plt.cm.ocean)
plt.colorbar()
plt.show()
Sigmoid
Sigmoid函数是一个在生物学中常见的S型的函数,也称为S型生长曲线。Sigmoid函数常被用作神经网络的阈值函数,将变量映射到0,1之间。
f ( x ) = 1 1 + e − x f(x)=\frac{1}{1+e^{-x}} f(x)=1+e−x1
wolframalpha search
import numpy as np
np.seterr(all='warn', over='ignore', under='ignore')

def sigmoid(x):
    return 1.0 / (1.0 + np.exp(-x))

sigmoid(np.array([-2110, -34, -5, 0, 2, 3, 4, 5, 16, 799, 10240]))
array([0.00000000e+00, 1.71390843e-15, 6.69285092e-03, 5.00000000e-01,
       8.80797078e-01, 9.52574127e-01, 9.82013790e-01, 9.93307149e-01,
       9.99999887e-01, 1.00000000e+00, 1.00000000e+00])
import matplotlib.pyplot as plt
sample = np.random.normal(0, 2, 256)
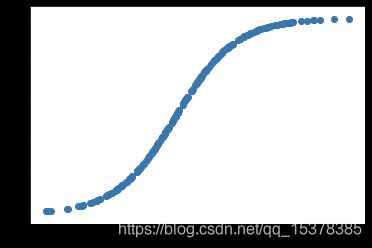
plt.scatter(sample, sigmoid(sample))
plt.show()
Softmax
Softmax函数,或称归一化指数函数,是逻辑函数的一种推广。它能将一个含任意实数的K维的向量z的“压缩”到另一个K维实向量σ(z) 中,使得每一个元素的范围都在(0,1)之间,并且所有元素的和为1。
中文乱码问题
plt.rcParams[‘font.sans-serif’]=[‘SimHei’] #用来正常显示中文标签
plt.rcParams[‘axes.unicode_minus’]=False #用来正常显示负号


