初识微积分三
优化算法
- 求一阶导数
- 求极值
- 求二阶导数检查是否为最大值
偏微分
对多变量函数
f ( x , y ) = x 2 + y 2 f(x,y) = x^2 + y^2 f(x,y)=x2+y2
对于变量x, 定义
∂ f ( x , y ) ∂ x = ∂ ( x 2 + y 2 ) ∂ x \frac{\partial f(x,y)}{\partial x} = \frac{\partial (x^2 + y^2)}{\partial x} ∂x∂f(x,y)=∂x∂(x2+y2)
∂ x 2 ∂ x = 2 x , ∂ y 2 ∂ x = 0 \frac{\partial x^2}{\partial x} = 2x,\;\;\; \frac{\partial y^2}{\partial x} = 0 ∂x∂x2=2x,∂x∂y2=0
∂ f ( x , y ) ∂ x = 2 x + 0 = 2 x \frac{\partial f(x,y)}{\partial x} = 2x + 0 = 2x ∂x∂f(x,y)=2x+0=2x
对于变量y
∂ f ( x , y ) ∂ y = 0 + 2 y = 2 y \frac{\partial f(x,y)}{\partial y} = 0 + 2y = 2y ∂y∂f(x,y)=0+2y=2y
计算梯度
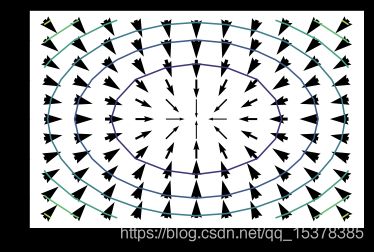
梯度是多唯曲面的切面
∂ f ( x , y ) ∂ x = 2 x ∂ f ( x , y ) ∂ y = 2 y \frac{\partial f(x,y)}{\partial x} = 2x \\ \frac{\partial f(x,y)}{\partial y} = 2y ∂x∂f(x,y)=2x∂y∂f(x,y)=2y
梯度向量:
g r a d ( f ( x , y ) ) = g ( x , y ) ⃗ = [ ∂ f ( x , y ) ∂ x ∂ f ( x , y ) ∂ y ] = [ 2 x 2 y ] grad(f(x,y)) = \vec{g(x,y)} = \begin{bmatrix}\frac{\partial f(x,y)}{\partial x} \\ \frac{\partial f(x,y)}{\partial y} \end{bmatrix} = \begin{bmatrix}2x \\ 2y \end{bmatrix} grad(f(x,y))=g(x,y)=[∂x∂f(x,y)∂y∂f(x,y)]=[2x2y]
%matplotlib inline
import matplotlib.pyplot as plt
import numpy as np
import math

el = np.arange(-5,6)
nx, ny = np.meshgrid(el, el, sparse=False, indexing='ij')

x_coord = []
y_coord = []
z = []
for i in range(11):
    for j in range(11):
        x_coord.append(float(-nx[i,j]))
        y_coord.append(float(-ny[i,j]))
        z.append(nx[i,j]**2 + ny[i,j]**2)

x_grad = [-2 * x for x in x_coord]
y_grad = [-2 * y for y in y_coord]

plt.xlim(-5.5,5.5)
plt.ylim(-5.5,5.5)
for x, y, xg, yg in zip(list(x_coord), list(y_coord), list(x_grad), list(y_grad)):
    if x != 0.0 or y != 0.0: ## Avoid the zero divide when scaling the arrow
        l = math.sqrt(xg**2 + yg**2)/2.0
        plt.quiver(x, y, xg, yg, width = l, units = 'dots')

z = np.array(z).reshape(11,11)
plt.contour(el, el, z)
图例
- 箭头是梯度方向
- 箭头宽度代表大小
- 梯度方向是垂直于曲面的
梯度下降算法
- 从一个起点开始。
- 计算这点的梯度。
- 沿着梯度方向探索一步。
- 判断梯度是否接近零,如果是,停止。
- 否则,从第2步继续。
积分
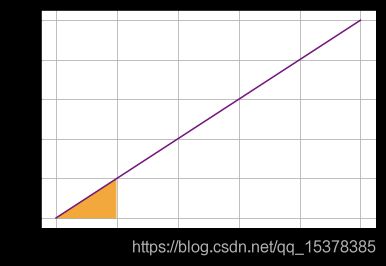
对函数 f ( x ) = x {f(x)=x} f(x)=x 有:
∫ f ( x ) d x = 1 2 x 2 \int f(x)\;dx = \frac{1}{2} x^2 ∫f(x)dx=21x2
∫ 0 2 f ( x ) d x = 1 2 x 2 ∣ 0 2 = 4 2 − 0 2 = 2 \int_0^2 f(x)\;dx = \frac{1}{2} x^2\ \big|_0^2 = \frac{4}{2} - \frac{0}{2} = 2 ∫02f(x)dx=21x2 ∣∣02=24−20=2
plt.xlabel('x')
plt.ylabel('f(x)')
plt.grid()

def f(x):
    return x

x = range(0, 11)
y = [f(a) for a in x]

plt.plot(x,y, color='purple')

section = np.arange(0, 2, 1/20)
plt.fill_between(section,f(section), color='orange')

plt.show()
import scipy.integrate as integrate
i, e = integrate.quad(lambda x: f(x), 0, 2)
print (i)
2.0
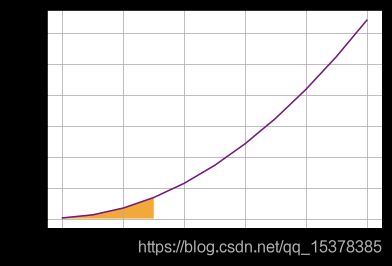
∫ 0 3 3 x 2 + 2 x + 1 d x = 3 3 x 3 + 2 2 x 2 + x ∣ 0 3 = 27 + 9 + 3 + 0 + 0 + 0 = 39 \int_0^3 3x^2 + 2x + 1\;dx = \frac{3}{3} x^3 + \frac{2}{2} x^2 + x\ \big|_0^3 = 27 + 9 + 3 + 0 + 0 + 0 = 39 ∫033x2+2x+1dx=33x3+22x2+x ∣∣03=27+9+3+0+0+0=39
from matplotlib.patches import Polygon


def g(x):
    return 3 * x**2 + 2 * x + 1

x = range(0, 11)
y = [g(a) for a in x]

fig, ax = plt.subplots()
plt.xlabel('x')
plt.ylabel('f(x)')
plt.grid()

plt.plot(x,y, color='purple')
ix = np.linspace(0, 3)
iy = g(ix)
verts = [(0, 0)] + list(zip(ix, iy)) + [(3, 0)]
poly = Polygon(verts, facecolor='orange')
ax.add_patch(poly)

plt.show()
i, e = integrate.quad(lambda x: 3 * x**2 + 2 * x + 1, 0, 3)
print(i)
print(e)
38.99999999999999
4.3298697960381095e-13
∫ 0 ∞ e − 5 x d x \int^{\infty}_0 e^{-5x} dx ∫0∞e−5xdx
import numpy as np
i, e = integrate.quad(lambda x: np.exp(-x*5), 0, np.inf)

print('Integral: ' + str(i))
print('Absolute Error: ' + str(e))
Integral: 0.20000000000000007
Absolute Error: 1.560666811361375e-11
∫ − ∞ ∞ 1 2 π e − x 2 ( 2 π ) d x \int_{-\infty}^{\infty} \frac{1}{2 \pi} e^{\frac{-x^2}{\sqrt(2 \pi)}} dx ∫−∞∞2π1e(2π)−x2dx
import numpy as np
norms = lambda x: np.exp(-x**2/2.0)/np.sqrt(2.0 * 3.14159)
i, e = integrate.quad(norms, -np.inf, np.inf)

print('Integral: ' + str(i))
print('Absolute Error: ' + str(e))
Integral: 1.0000004223321999
Absolute Error: 1.0178195684846592e-08


