1-12 作业
matplotlib 布局 作业
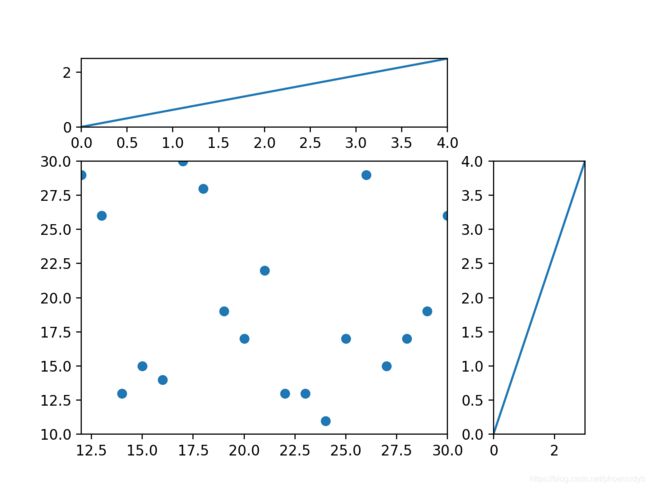
import matplotlib.pyplot as plt
import random
fig=plt.figure()

width=(4,1)
height=(1,4)
gr=fig.add_gridspec(2,2,width_ratios=width,height_ratios=height)
ax1=fig.add_subplot(gr[0,0])
ax1.set_xlim([0,4])
ax1.set_ylim([0,2.5])
ax1.plot([0,4],[0,2.5])
ax2=fig.add_subplot(gr[1,0])
ax2.set_xlim(0,28)

ax2.set_ylim([10,30])
ax2.set_xlim([12,30])
ax2.scatter(range(12,31),[random.randint(11,30) for i in range(12,31)])
ax3=fig.add_subplot(gr[1,1])
ax3.set_ylim([0,4])
ax3.set_xlim([0,3])
ax3.plot([0,3],[0,4])
plt.show()
实现效果如下: