可视化篇(四)——— python绘制双y轴、箱线图、概率分布三种图形及案例
可视化篇(四)——— python绘制双y轴、箱线图、概率分布三种图形及案例
- 摘要
- 绘制双y轴图形
- 绘制箱线图
- 绘制概率分布图
摘要
本文演示了如何通过python绘制双y轴、箱线图、概率分布三种图形,并给出了具体案例供读者参考。
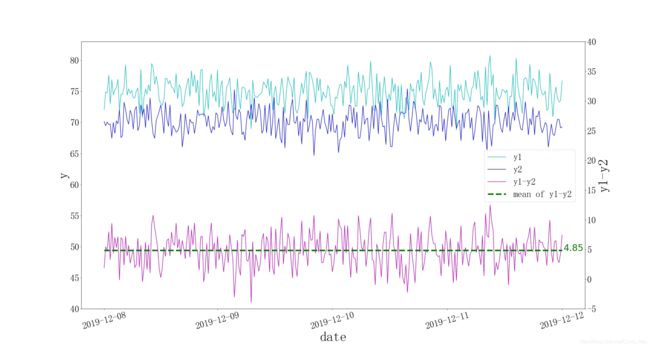
绘制双y轴图形
import numpy as np
import matplotlib.pyplot as plt
from matplotlib.font_manager import FontProperties
import datetime

# 此设置为使图形能显示带特殊格式的字符
plt.rcParams['axes.unicode_minus'] = False

# 构建虚拟数据
"""
x轴为日期
左y轴为y1,y2
右y轴为 y1-y2 及其均值
"""
date = [(datetime.datetime.strptime("2019-12-08 00:00:00","%Y-%m-%d %H:%M:%S") + datetime.timedelta(days=i)).strftime("%Y-%m-%d%H:%M:%S")[:10] for i in range(300)]
x = np.arange(300)
x_ticks = [int(i) for i in np.linspace(0, (x.shape[0] - 1), 5)]
y1 = np.random.randn(300) *2 + 75
y2 = np.random.randn(300) *2 + 70

# 设置字体
font = FontProperties(fname="C:\Windows\Fonts\simsun.ttc", size=30)

figure = plt.figure(figsize=[30, 16], dpi=72)

ax1 = figure.add_subplot(111)

fig1 = ax1.plot(x, y1, color="c", label="y1")
fig2 = ax1.plot(x, y2, color="b", label="y2")
plt.yticks(fontproperties=font)
plt.xlabel("date", fontproperties=FontProperties(fname="C:\Windows\Fonts\simsun.ttc", size=45))
plt.xticks(x_ticks, date, fontproperties=FontProperties(fname="C:\Windows\Fonts\simsun.ttc", size=30), rotation=15)
ax1.set_ylim(40, 83)
ax1.set_ylabel("y", fontproperties=FontProperties(fname="C:\Windows\Fonts\simsun.ttc", size=45))

ax2 = ax1.twinx()

fig3 = ax2.plot(x, y1-y2, color="m", label="y1-y2")
fig4 = ax2.plot(x, [(y1-y2).mean()] * (x.shape[0]), color="g", linestyle="--", linewidth=5, label="mean of y1-y2")
ax2.set_ylim(-5, 40)
ax2.set_ylabel("y1-y2", fontproperties=FontProperties(fname="C:\Windows\Fonts\simsun.ttc", size=45))
plt.yticks(fontproperties=font)

# 显示均值
ax2.text(x.shape[0], (y1-y2).mean() - 0.1, str((y1-y2).mean())[:4], fontdict={
     "size": 30, "color": "g"})

# 设置图列
legends = fig1 + fig2 + fig3 + fig4
labels = [l.get_label() for l in legends]
plt.legend(legends, labels, prop=font, loc=(0.8, 0.4))

plt.show()
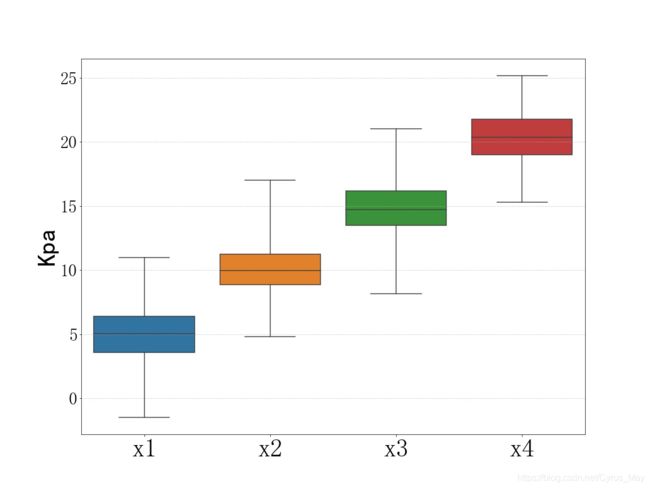
绘制箱线图
代码如下
import numpy as np
import matplotlib.pyplot as plt
from matplotlib.font_manager import FontProperties
import seaborn as sns
import pandas as pd

# 此设置为使图形能显示带特殊格式的字符
plt.rcParams['axes.unicode_minus'] = False

# 构建虚拟数据
"""
绘制x1,x2,x3,x4四组数据的箱线图
"""
x1 = np.random.randn(200)*2+5
x2 = np.random.randn(200)*2+10
x3 = np.random.randn(200)*2+15
x4 = np.random.randn(200)*2+20
data = np.array([x1,x2,x3,x4]).T
df = pd.DataFrame(data,columns=["x1","x2","x3","x4"])

font = FontProperties(fname = "C:\Windows\Fonts\simsun.ttc",size=30)
figure = plt.figure(figsize=[16,12],dpi=72)

# whis为异常值在上下四分位点差值的多少倍以外
sns.boxplot(data = df, whis=3, orient="v", fliersize=15)
plt.ylabel("Kpa", fontproperties=FontProperties(fname="C:\Windows\Fonts\simhei.ttf", size=45))
plt.yticks(fontproperties=font)
plt.xticks(fontproperties = FontProperties(fname = "C:\Windows\Fonts\simsun.ttc",size=45))
plt.grid(linestyle="--", linewidth=1, alpha=0.5, axis="y")
plt.show()
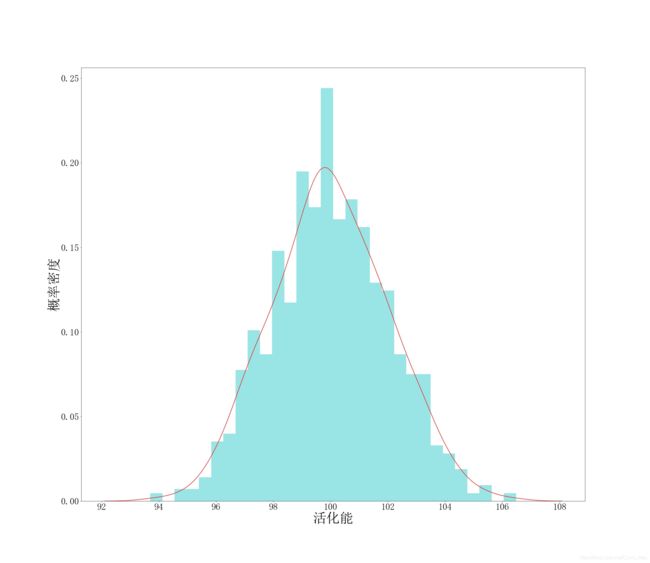
绘制概率分布图
import numpy as np
import matplotlib.pyplot as plt
from matplotlib.font_manager import FontProperties
import seaborn as sns

# 此设置为使图形能显示带特殊格式的字符
plt.rcParams['axes.unicode_minus'] = False

# 构建虚拟数据
"""
绘制x的概率分布图
"""
x = np.random.randn(1000)*2+100
figure = plt.figure(figsize=[30,26],dpi=72)
sns.distplot(x,bins=30,kde_kws={
     "color":"red"},color="c")
plt.xticks(fontproperties=FontProperties(fname="C:\Windows\Fonts\simsun.ttc",size=30))
plt.yticks(fontproperties=FontProperties( fname="C:\Windows\Fonts\simsun.ttc",size=30))
plt.xlabel(xlabel="活化能",fontproperties = FontProperties( fname="C:\Windows\Fonts\simsun.ttc",size=45))
plt.ylabel("概率密度",fontproperties = FontProperties( fname="C:\Windows\Fonts\simsun.ttc",size=45))

plt.show()
by CyrusMay 2021 01 25
脱下长日的假面
奔向梦幻的疆界
南瓜马车的午夜
换上童话的玻璃鞋
——————五月天(拥抱)——————


