Machine learning can be complicated…and intimidating to learn when you’re starting out. Spreadsheets on the other hand are simple. They aren’t sexy, but they strip away the distractions and help you visualize what happens behind the code in an intuitive way.
Using step-by-spreadsheets (which you can view or download using the link below), I’ll show you how the convolutional neural nets (“CNNs”) used in computer vision work. There’s a bit of math, but you can follow all formulas in the spreadsheets:
https://drive.google.com/open?id=1TJXPPQ6Cz-4kVRXTSrbj4u4orcaamtpGvY58yuJbzHk
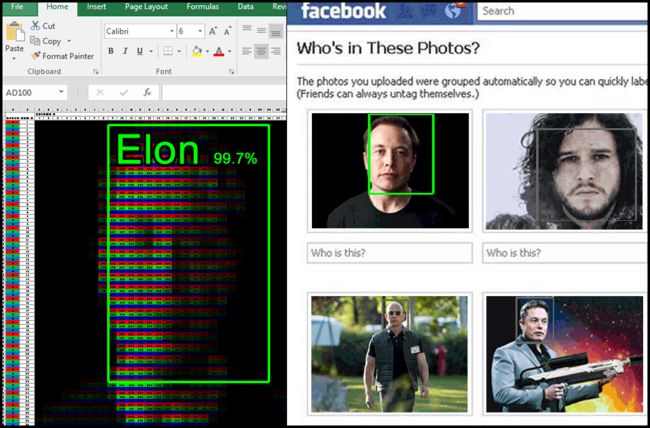
The spreadsheet model looks at a picture, analyzes its pixels, and predicts if it is Elon Musk, Jeff Bezos, orrrrr Jon Snow…obviously 3 of Skynet’s greatest threats.
This post will cover the 9 steps above and use an analogy for each step to help supercharge your intuition.
The goal is to give you a simple path to getting started in machine learning and show curious minds how cutting-edge AI works “under the hood” with easy-to-follow spreadsheets. If this helps you, consider signing up for my email list by clicking below and I’ll send you more spreadsheets that help you get started in machine learning.

Facebook面部识别系统、某国奥威尔式的大规模监控系统、你的汽车(不久的将来)背后的基础都是计算机视觉。
Fascinating illustration of Deeping Learning and LiDAR perception in Self-Driving Cars and other Autonomous Vehicle
Big Picture Analogy: CNNs are like Sherlock Holmes
Let’s start by pretending that inside the mind of Terminator lives a special detective called ‘Sherlock Convolution Holmes.’ His job is to carefully look at the evidence (the input image) and using his keen eye and deduction abilities (feature detection), he predicts who’s in the picture and cracks the case (correctly classify the image)
-Each of the 9 steps below will be part of this big picture analogy.

Inputs — A picture is worth a thousand numbers
When I look at this picture, I see a visionary. A guy who is simultaneously improving planet earth AND building a rocket to escape it in case Terminator tries to blow it up. Unlike a computer, I don’t see pixel values and I can’t tell a picture is just a stacked combination of red, green, and blue light:

A computer (i.e. Skynet) on the other hand, is blind…it just sees numbers.
Think of a digital photograph as 3 spreadsheets (1 red, 1 green, 1 blue) stacked on top of each other and each spreadsheet is a matrix of numbers. When you take a photo, your camera measures the amount of red, green, and blue light hitting each pixel. It then ranks each pixel on a scale of 0–255 and records them on a spreadsheet:
If we split each color into a separate matrix, we have 3 28x28 matrices and each matrix is an input that we’ll use to train our neural net:
*Sidebar: If you want to learn how to convert any picture into a conditionally-formatted Excel file in about 30 seconds, head over to:
http://think-maths.co.uk/spreadsheet
You’ll learn how to take an “Ex-celfie” that your fellow spreadsheet-slinging colleagues will love…trust me, they’ll get a good laugh at seeing your mug (or theirs) in a spreadsheet ? (small images work best).
Training overview --Like computer,like child
When you were born, did you know what a dog was? No, of course not. But over time, your parents showed you pictures of dogs in books, in cartoons, in real life and eventually…you could point at those 4-legged furry animals and say “dog.” The connections between the billions of neurons in your brain became strong enough that you could recognize dogs.
The Terminator learned to see Elon in the same manner. Through a process called supervised training, it was shown thousands of pictures of Elon Musk, Jeff Bezos, and Jon Snow. At first, it had a 1 in 3 chance of guessing who it was…but like a child…it improved over time as it saw more images during training. The connections or “weights/biases” of the network were updated over time such that it could predict image outputs based on pixel inputs. This is the process of learning (gradient descent) discussed in part 1.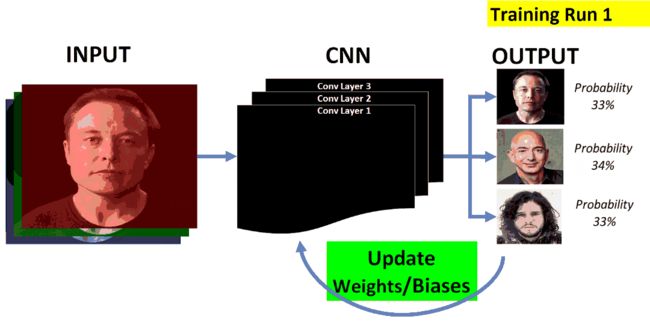
CNN learning to see — the training loop
So what makes a convolutional neural network different than a normal neural net?
In 2 words: translation invariance.
Yeah…that means nothing to me either. Let’s de-construct:
- Translation = moving something from 1 place to another
- Invariance = it doesn’t change
For computer vision, this means that regardless of where an object is moved in an image (translation), it doesn’t change what that object is (invariance).
The convolutional neural net has to be trained to recognize Elon’s features no matter where he’s at in the image (translation) and no matter his size (scale invariance).
CNNs excel at recognizing patterns in any part of an image and then stacking these patterns on top of one another to build more complex patterns…like a human.
In a normal neural net, we would treat each individual pixel as an input (not 3 matrices) to our model, but this ignores the fact that pixels close together have special meaning and structure. With CNNs, we look at groups of pixels next to one another which allows the model to learn local patterns like shapes, lines, etc. For example — if the CNN saw lots of white pixels around a black circle, it would recognize this pattern as an eye.
To get CNNs to accomplish translation variance, they rely on the services of its’ feature detective, Sherlock Convolution Holmes.
Meet Sherlock Convolution Holmes — the Feature Detective
Sherlock lives inside the mind of Terminator. Using his magnifying glass, he scrutinizes 1 patch of an image at a time and finds the important features or “clues” of that image. As he collects clues like simple lines and shapes, he stacks them on top of one another and starts to see facial features like an eye or a nose.
Each convolutional layer holds a stack of feature maps or “clues” that build on one another. At the end of the case, he puts all of these clues together and he’s able to crack the case and correctly identify his target.
Each convolutional layer of the network has a set of feature maps that can recognize increasingly complex patterns/shapes in a hierarchal manner like below.
The CNN uses pattern recognition of numbers to figure out the most important features of any image. As it stacks these patterns on top of each other with more layers, it can build very complex feature maps.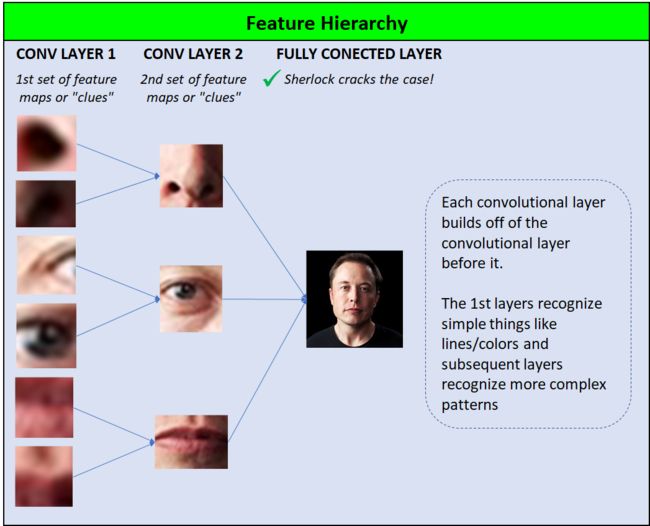
Real-life CNNs do the exact same thing as Sherlock:
What makes CNNs so amazing is that they learn these features on their own…an engineer doesn’t write code that says look for a set of 2 eyes, 1 nose, a mouth, etc.
In this way, the engineer is more like an architect. They tell Sherlock, “I’m giving you 2 stacks (“convolutional layers”) of blank feature maps (“clues”) and it’s your job to analyze the picture and find the most important clues. The first stack has 16 feature maps (“clues”), the 2nd stack has 64 features maps….now go put your detective skills to use and solve the case!”
For Sherlock to find the “clues” in the case (i.e. “calculate a feature map”), he relies on several tools in his detective kit and we’ll cover each:
- Filters — Sherlock’s magnifying glasses ?
- Convolution Math — Filter weights x input image pixels
- Striding — Moving the filter around the input image ? ➡️ ? ➡️
- Padding — Like “crime scene tape” to protect the clues ?
Sherlock’s Magnifying Glasses/Filters
Sherlock’s undoubtedly very sharp and has astute observation skills, but he couldn’t do his job without his collection of special magnifying glasses or “filters.” He uses a different magnifying glass to help him fill in the details of each blank feature map. So, if he had 16 feature maps…he’d have 16 magnifying glasses.
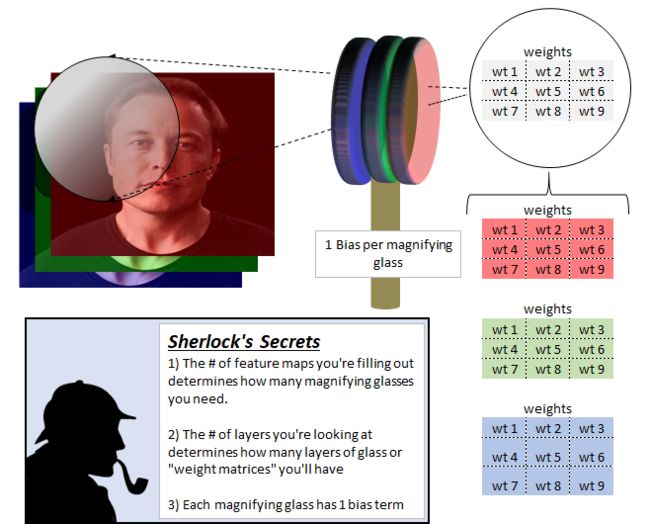
Each magnifying glass is made up of multiple layers of glass and each layer of glass is made up of different weights. The number of layers of glass, our “filter depth”, always matches the layer depth from the input layer he’s looking at.
At first, Sherlock is looking at our input image which has 3 layers — red, green, and blue. So…our magnifying glass would also have 3 layers.
As we build the CNN, our layer depth increases so our magnifying glass would also get thicker.
In order for Sherlock to build 1 feature map or “clue”, he starts by taking out 1 of his magnifying glasses and places it in the top left section of an input image. The red layer of glass can only see the red input image, the green glass sees the green image, and the blue glass sees the blue image.
Now for the math.
Convolution Math
Each pixel in our feature map is 1 part of a clue. And to calculate each pixel, Sherlock has to do perform some basic multiplication and addition.
In our example below using a 5x5x3 input image and a 3x3x3 filter, there are 27 multiplications required for 1 pixel:
3 layers x 9 multiplication convolutions per layer = 27
Each of the 27 numbers is added together.
After adding the 27 calcs together, we add 1 more number — our bias.
Convolution Calculation — Sherlock building his feature maps or “clues”
Let’s zoom in and look at the math. A pixel is made up of 27 multiplications (3 layers x 9 multiplications per layer) and the screenshot below shows 9 of the 27 multiplications:
前沿人脸识别是一个复杂的过程。这些电子表格使它更容易。
Cutting-Edge Face Recognition is Complicated. These Spreadsheets Make it Easier.
9 Steps to Building a Deep Convolutional Neural Net in Excel for Normal Humans.
Machine learning can be complicated…and intimidating to learn when you’re starting out. Spreadsheets on the other hand are simple. They aren’t sexy, but they strip away the distractions and help you visualize what happens behind the code in an intuitive way.
Using step-by-spreadsheets (which you can view or download using the link below), I’ll show you how the convolutional neural nets (“CNNs”) used in computer vision work. There’s a bit of math, but you can follow all formulas in the spreadsheets:
https://drive.google.com/open?id=1TJXPPQ6Cz-4kVRXTSrbj4u4orcaamtpGvY58yuJbzHk
The spreadsheet model looks at a picture, analyzes its pixels, and predicts if it is Elon Musk, Jeff Bezos, orrrrr Jon Snow…obviously 3 of Skynet’s greatest threats.
Terminator Vision — Creating a convolutional neural net in a spreadsheet
This post will cover the 9 steps above and use an analogy for each step to help supercharge your intuition.
The goal is to give you a simple path to getting started in machine learning and show curious minds how cutting-edge AI works “under the hood” with easy-to-follow spreadsheets. If this helps you, consider signing up for my email list by clicking below and I’ll send you more spreadsheets that help you get started in machine learning.
Computer vision is the foundation behind Facebook facial recognition system, China’s Orwellian mass surveillance, and pretty soon, your car:
Big Picture Analogy: CNNs are like Sherlock Holmes
Let’s start by pretending that inside the mind of Terminator lives a special detective called ‘Sherlock Convolution Holmes.’ His job is to carefully look at the evidence (the input image) and using his keen eye and deduction abilities (feature detection), he predicts who’s in the picture and cracks the case (correctly classify the image).
Each of the 9 steps below will be part of this big picture analogy.
Convolutional neural net architecture
Inputs — A picture is worth a thousand numbers
Skynet’s biggest threat, Elon Musk
When I look at this picture, I see a visionary. A guy who is simultaneously improving planet earth AND building a rocket to escape it in case Terminator tries to blow it up. Unlike a computer, I don’t see pixel values and I can’t tell a picture is just a stacked combination of red, green, and blue light:
A computer (i.e. Skynet) on the other hand, is blind…it just sees numbers.
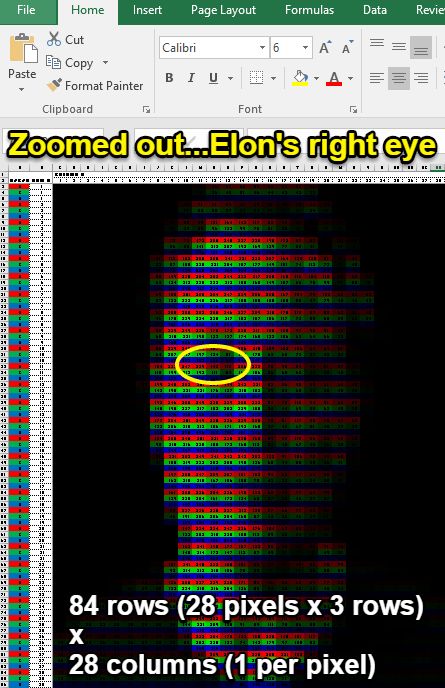
Think of a digital photograph as 3 spreadsheets (1 red, 1 green, 1 blue) stacked on top of each other and each spreadsheet is a matrix of numbers. When you take a photo, your camera measures the amount of red, green, and blue light hitting each pixel. It then ranks each pixel on a scale of 0–255 and records them on a spreadsheet:
Computers see spreadsheets
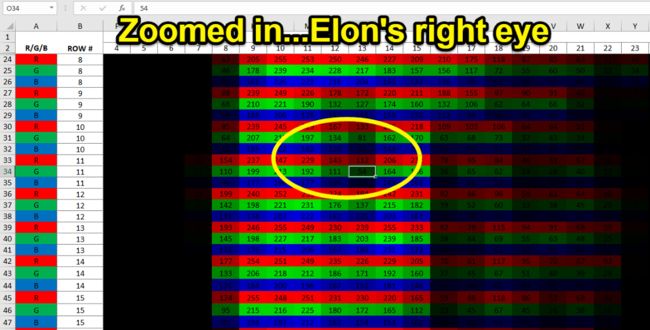
In the 28x28 image above, each pixel is represented by 3 rows (1 red, 1 blue, and 1 green) and has a value of 0–255. The pixels have been conditionally formatted based on their value.
Terminator doesn’t see an eye, he sees a bunch of numbers
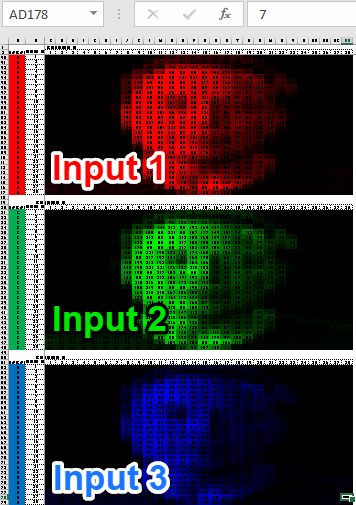
If we split each color into a separate matrix, we have 3 28x28 matrices and each matrix is an input that we’ll use to train our neural net:
Model inputs
*Sidebar: If you want to learn how to convert any picture into a conditionally-formatted Excel file in about 30 seconds, head over to:
http://think-maths.co.uk/spreadsheet
You’ll learn how to take an “Ex-celfie” that your fellow spreadsheet-slinging colleagues will love…trust me, they’ll get a good laugh at seeing your mug (or theirs) in a spreadsheet ? (small images work best).
Training overview — Like computer, like child
When you were born, did you know what a dog was? No, of course not. But over time, your parents showed you pictures of dogs in books, in cartoons, in real life and eventually…you could point at those 4-legged furry animals and say “dog.” The connections between the billions of neurons in your brain became strong enough that you could recognize dogs.
The Terminator learned to see Elon in the same manner. Through a process called supervised training, it was shown thousands of pictures of Elon Musk, Jeff Bezos, and Jon Snow. At first, it had a 1 in 3 chance of guessing who it was…but like a child…it improved over time as it saw more images during training. The connections or “weights/biases” of the network were updated over time such that it could predict image outputs based on pixel inputs. This is the process of learning (gradient descent) discussed in part 1.
CNN learning to see — the training loop
So what makes a convolutional neural network different than a normal neural net?
In 2 words: translation invariance.
Yeah…that means nothing to me either. Let’s de-construct:
Translation = moving something from 1 place to another
Invariance = it doesn’t change
For computer vision, this means that regardless of where an object is moved in an image (translation), it doesn’t change what that object is (invariance).
Translation Invariance (Plus scale invariance to exaggerate the point)
The convolutional neural net has to be trained to recognize Elon’s features no matter where he’s at in the image (translation) and no matter his size (scale invariance).
CNNs excel at recognizing patterns in any part of an image and then stacking these patterns on top of one another to build more complex patterns…like a human.
In a normal neural net, we would treat each individual pixel as an input (not 3 matrices) to our model, but this ignores the fact that pixels close together have special meaning and structure. With CNNs, we look at groups of pixels next to one another which allows the model to learn local patterns like shapes, lines, etc. For example — if the CNN saw lots of white pixels around a black circle, it would recognize this pattern as an eye.
To get CNNs to accomplish translation variance, they rely on the services of its’ feature detective, Sherlock Convolution Holmes.
Meet Sherlock Convolution Holmes — the Feature Detective
Sherlock searching for features
Sherlock lives inside the mind of Terminator. Using his magnifying glass, he scrutinizes 1 patch of an image at a time and finds the important features or “clues” of that image. As he collects clues like simple lines and shapes, he stacks them on top of one another and starts to see facial features like an eye or a nose.
Each convolutional layer holds a stack of feature maps or “clues” that build on one another. At the end of the case, he puts all of these clues together and he’s able to crack the case and correctly identify his target.
Each feature map is like another “clue”
Each convolutional layer of the network has a set of feature maps that can recognize increasingly complex patterns/shapes in a hierarchal manner like below.
The CNN uses pattern recognition of numbers to figure out the most important features of any image. As it stacks these patterns on top of each other with more layers, it can build very complex feature maps.
Real-life CNNs do the exact same thing as Sherlock:
Convolutional neural net detecting features
What makes CNNs so amazing is that they learn these features on their own…an engineer doesn’t write code that says look for a set of 2 eyes, 1 nose, a mouth, etc.
In this way, the engineer is more like an architect. They tell Sherlock, “I’m giving you 2 stacks (“convolutional layers”) of blank feature maps (“clues”) and it’s your job to analyze the picture and find the most important clues. The first stack has 16 feature maps (“clues”), the 2nd stack has 64 features maps….now go put your detective skills to use and solve the case!”
For Sherlock to find the “clues” in the case (i.e. “calculate a feature map”), he relies on several tools in his detective kit and we’ll cover each:
- Filters — Sherlock’s magnifying glasses ?
- Convolution Math — Filter weights x input image pixels
- Striding — Moving the filter around the input image ? ➡️ ? ➡️
- Padding — Like “crime scene tape” to protect the clues ?
Sherlock’s Magnifying Glasses/Filters
Sherlock’s undoubtedly very sharp and has astute observation skills, but he couldn’t do his job without his collection of special magnifying glasses or “filters.” He uses a different magnifying glass to help him fill in the details of each blank feature map. So, if he had 16 feature maps…he’d have 16 magnifying glasses.
Each magnifying glass is made up of multiple layers of glass and each layer of glass is made up of different weights. The number of layers of glass, our “filter depth”, always matches the layer depth from the input layer he’s looking at.
At first, Sherlock is looking at our input image which has 3 layers — red, green, and blue. So…our magnifying glass would also have 3 layers.
As we build the CNN, our layer depth increases so our magnifying glass would also get thicker.
In order for Sherlock to build 1 feature map or “clue”, he starts by taking out 1 of his magnifying glasses and places it in the top left section of an input image. The red layer of glass can only see the red input image, the green glass sees the green image, and the blue glass sees the blue image.
Now for the math.
Convolution Math
Each pixel in our feature map is 1 part of a clue. And to calculate each pixel, Sherlock has to do perform some basic multiplication and addition.
In our example below using a 5x5x3 input image and a 3x3x3 filter, there are 27 multiplications required for 1 pixel:
- 3 layers x 9 multiplication convolutions per layer = 27
- Each of the 27 numbers is added together.
- After adding the 27 calcs together, we add 1 more number — our bias.
Let’s zoom in and look at the math. A pixel is made up of 27 multiplications (3 layers x 9 multiplications per layer) and the screenshot below shows 9 of the 27 multiplications:
In terms of the bias, you can think of it as the handle of each magnifying glass. Like the weights, it’s another parameter of the model that is tweaked each training run to improve the model’s accuracy and update the feature map details.
Filter weights — In the example above, I kept the weights to 1s and 0s to make the math easier; however, in a normal neural net, you would initialize your starting weights with random lower values…like values between (.01) and 0.1 using a bell-curve or normal distribution type approach. To learn more about weight initialization, check out this introduction.
Striding — Moving the Magnifying Glass
After calculating the 1st pixel in the feature map, where does Sherlock move his magnifying glass next?
The answer depends on the striding parameter. As the architect/engineer, we have to tell Sherlock how many pixels he should move or “stride” his magnifying glass to the right before he calculates the next pixel in his feature map. A stride of 2 or 3 is most common in practice, but we’ll stick with 1 here to keep it simple. This means that Sherlock moves his glass 1 pixel to the right and then he’ll perform the same convolution calcs as before.
When his glass reaches the far-right edge of the input image, he then moves his magnifying glass 1 pixel down and all the way to the left.
Why would you stride more than 1?
PROS:
- Makes your model faster by having less calculations and fewer calculations to store in memory.
CONS:
- You lose information about the picture because you would skip pixels and potentially miss out on seeing a pattern.
A stride of 2 or 3 usually makes sense because pixels immediately next to one another typically have similar values, but if they are 2–3 pixels apart, there’s more likely to be variations in pixel values that are important for the feature map/pattern.
How to Prevent Information Loss (Losing the Clues)
In order for Sherlock to crack his case, he needs a lot of clues at the beginning of a case. In the example above, we took a 5x5x3 image, or 75 pixels of information (75 = 5 x 5 x 3), and we only ended up with a 3x3x2 image, or 18 pixels (18 = 3 x 3 x 2) after our first convolutional layer. This means we lost evidence and this makes his partner, John Watson, very upset.
In the first couple layers of a CNN, Sherlock likes to see lot of tiny patterns (more clues). In the later layers, it’s ok to “down-sample” and decrease our total volume of pixels (less clues) as Sherlock stacks the tiny clues and looks at larger patterns.
So how do we prevent this information loss at the beginning of a CNN?
1: Padding — We must protect the crime scene with “padding” around our image.
In our example, we could only move the filter 3 times before we hit the right edge…and the same from top-to-bottom. This means our resulting output height/width was 3x3 and we lost 2 pixels from left-to-right and another 2 pixels from moving our filter top-to-bottom.
To prevent this information loss, it’s common to “pad” the original image with zeros (referred to as “zero padding” or “same padding”)…kinda like crime scene tape to ensure nobody tampers with the clues like this: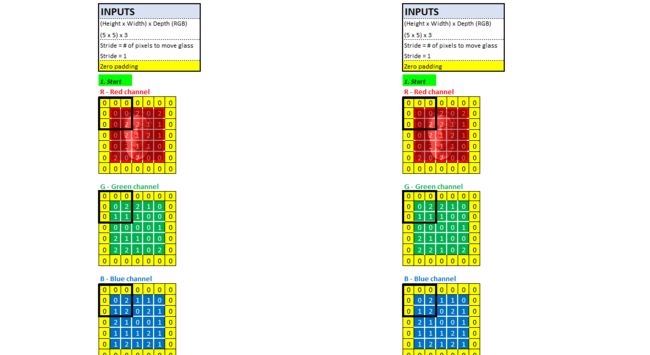
After padding, if Sherlock used his same magnifying glasses again, his 2 feature maps would both be 5x5 instead of 3x3.
This means we’d be left with 50 pixels of information since our new output from this convolution is 5x5x2 = 50.
50 pixels is better than 18. But remember…we started with 75 pixels so we’re still missing some clues.
So what else can we do to make Sherlock and John Watson happy?
2: More Filters — Give Sherlock more clues by adding at least 1 feature map to our convolutional layer
There’s no limit to the # of feature maps or “clues” our model has…this is a parameter that we control.
If we increase our feature maps from 2 to at least 3 (5x5x2…to…5x5x3) then our total output pixels (75) matches our input pixels (75) and we ensure we don’t have information loss. If we increase the maps to 10, then we‘d have even more information for Sherlock to sort through (250 pixels = 5 x 5 x 10) as he finds his clues.
In summary, the total pixel information in the first few layers is generally higher than our input image because we want to give Sherlock as many tiny clues/patterns as possible. In the last several layers of our network, it’s common to downsample and have fewer pixels because these layers are recognizing larger patterns of the image.
Non-Linear Pattern Recognition — ReLUs
Giving Sherlock enough information in a case is important, but now comes time for true detective work — NON-linear pattern recognition! Like the curvature of an ear or the nostril of a nose.
Thus far, Sherlock has done a bunch of math to build his feature maps, but each calculation has been linear (takes input pixels and performs same multiplication/addition on each pixel) and therefore, he can only identify linear patterns of pixels.
To introduce non-linearity in CNNs, we use an activation function called a Rectified Linear Unit or “ReLU” for short. After we calculate our feature maps from the first convolution, each value is ran through this function to see if it lights up or is “activated.”
If the input value is negative, then the output turns into a zero. If the input is positive, then the output value remains unchanged. The ReLU acts like an on/off switch and after you run each value of your feature map through the ReLU, you create non-linear pattern recognition.
Coming back to our original CNN example, we would apply the ReLU right after the convolution:
While there are a number of non-linear activation functions you can use to introduce non-linearity into a neural net (sigmoids, tanh, leaky ReLU, etc.), ReLUs are the most popular used in CNNs today because they are computationally efficient and result in faster learning. Check out Andrej Karpathy’s overview on non-linear activation functions to learn about the pros/cons for each function.
Max Pooling — Keeping the Critical Few in the Brain Attic
Now that Sherlock has some feature maps, or “clues”, to start looking at, how does he determine which information is critical vs. irrelevant details? Max Pooling.
Sherlock thinks of the human brain like an empty attic. The fool will store all sorts of furniture and items up there such that the useful information ends up getting lost in all the clutter. The wise person only stores the most important info which allows them to make quick decisions when called upon. In this way, max pooling is Sherlock’s version of the brain attic. In order for him to make decisions quickly, he only keeps the most important info.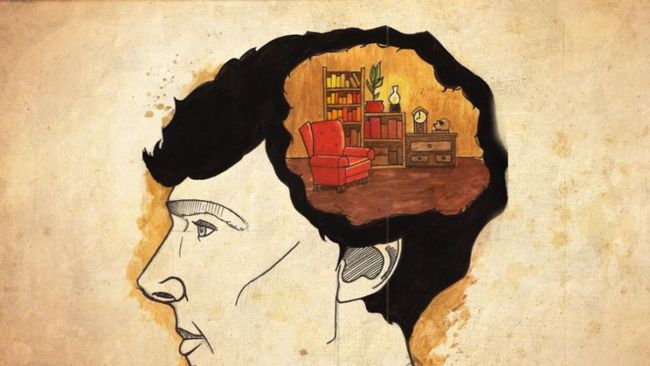
With max pooling, he looks at a neighborhood of pixels and only keeps the “maximum” value or “most important” pieces of evidence.
For example, if he’s looking at a 2x2 area (4 pixels), he only keeps the pixel with the highest value and discards the other 3. This technique allows him to learn fast and also helps him generalize (as opposed to ‘memorize’) clues that he can store and remember for future images.
Similar to our magnifying glass filter earlier, we also control the stride of max pooling and the pooling size. In our example below, we’ll assume a stride of 1 and a 2x2 pooling size: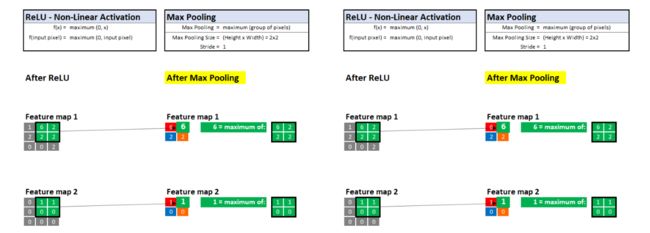
After max pooling, we’ve completed 1 round of convolution/ReLU/max pooling.
In a typical CNN, there would be several rounds of convolution/ReLU/pooling until we got to our classifier. With each round, we would be squeezing the height/width while adding depth so that we don’t lose pieces of evidence along the way.
Steps 1–5 were focused on gathering the evidence and now it’s time for Sherlock to look at all the clues and solve the case:
Now that we have the evidence, let’s start to make sense of it all..
When Sherlock gets to the end of a training loop, he has a mountain of clues scattered all over the place and needs a way to look at all of them at once. Each clue is a simple 2-dimensional matrix of values, but we have thousands of them piled on top of one another.
As a private detective, Sherlock thrives in this type of chaos, but he has to bring his evidence to the courtroom and organize them for a jury.
[center]Feature maps prior to flattening[/center]
e does this by using a simple transformation technique called flattening:
1.Each 2-D matrix of pixels is turned into 1 column of pixels
2.Each 1 of our 2-D matrices is placed on top of another.
Here’s what a transformation would look like to the human eye…
Coming back to our example, here’s what the computer sees…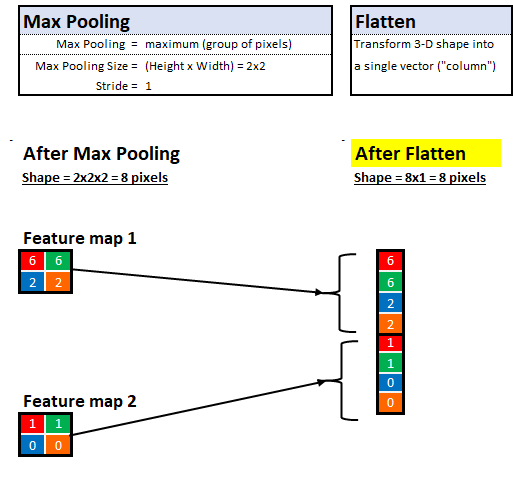
Now that Sherlock has organized his evidence, it’s time for him to convince the jury that the evidence clearly points to 1 suspect.
In a fully connected layer, we connect the evidence to each suspect. In a sense, we are “connecting the dots” for the jury by showing them the link between the evidence and each suspect:
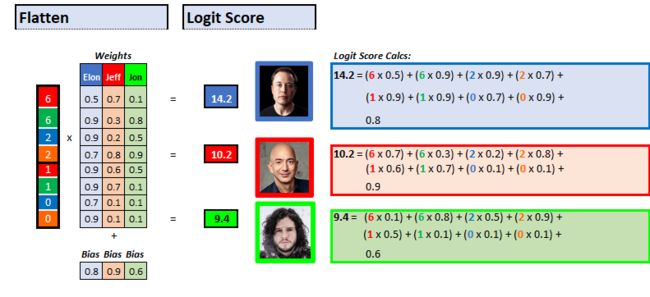
Here’s what the computer would see using our numerical example: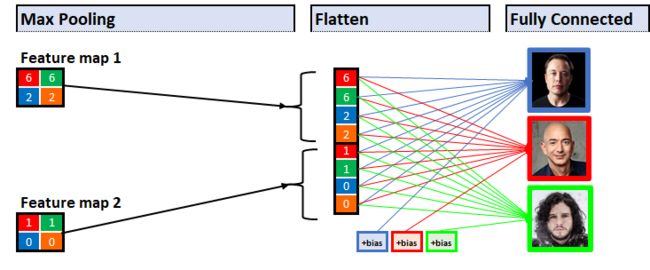
In between each piece of evidence in the flatten layer and the 3 outputs are a bunch of weights and biases. Like the other weights in the network, these would be initialized at random values when we first start training the CNN and over-time, the CNN would “learn” how to adjust these weights/biases to result in increasingly accurate predictions.
Now it’s time for Sherlock to crack the case!
In the image classifier stage of the CNN, the model’s prediction is the output with the highest score. The goal is to have a high score for the correct output and low scores for the incorrect outputs.
There are 2 parts of this scoring function:
- Logit Score — The raw score
- Softmax — The probability for each output between 0–1. The sum of all scores equals 1.
Part 1: Logits — The Logical Scores
The logit score for each output is a basic linear function:
Logit Score = (Evidence x Weights) + Bias
Each piece of evidence is multiplied by the weight that connects the evidence to the output. All of these multiplications are added together and we add a bias term at the end and the highest score is the model’s guess.
o why don’t we stop here? 2 intuitive reasons:
Sherlock’s level of confidence — we want to know how confident Sherlock is so we can reward him when he has a high degree of confidence AND he’s right…and penalize him when he has a high degree of confidence AND he’s wrong. This reward/penalty is captured when we compute the loss (“Sherlock’s accuracy”) at the end.
Sherlock’s confidence-weighted probability — we want an easy way to interpret these as probabilities between 0–1 and we want to get our predicted scores on the same scale as the actual outputs (0 or 1). The actual correct image (Elon) has a 1 and the other incorrect images (Jeff and Jon) have zeros. The process of turning correct outputs into ones and incorrect outputs into zeros is called one-hot encoding.
Sherlock’s goal is have his prediction be as close to 1 as possible for the correct output.
Part 2: Softmax — Sherlock’s Confidence-Weighted Probability Scores
2.1. Sherlock’s level of confidence:
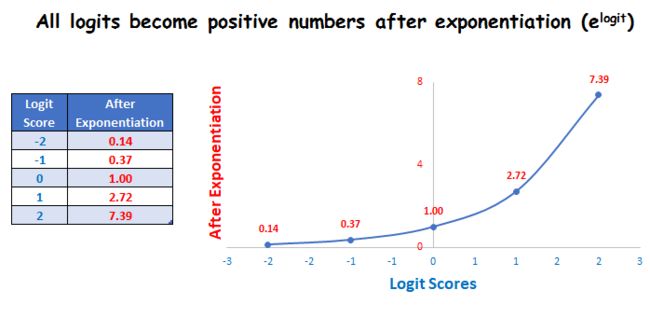
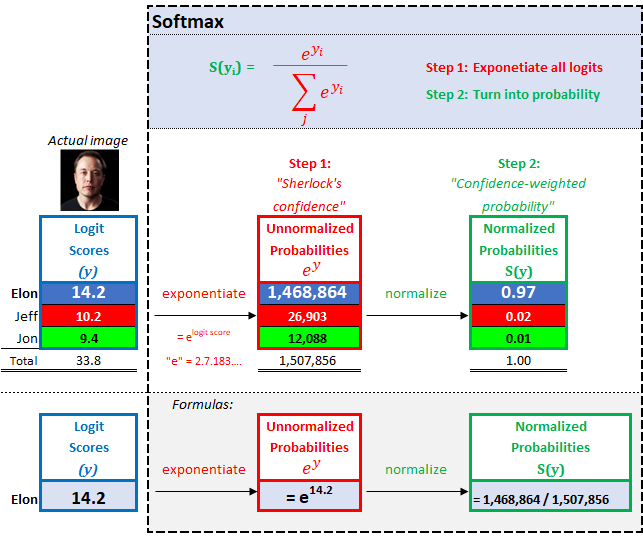
To find Sherlock’s level of confidence, we take the letter e (which equals 2.71828…) and raise or “exponentiate” it by the logit score. A high score becomes really high confidence and a low score becomes really low confidence.
This exponentiation calculation also ensures we don’t have any negative scores. Since our logit scores “could” be negative, here’s what what happen to hypothetical logit scores after the exponentiation:
2.2 Sherlock’s confidence-weighted probability:
To find the confidence-weighted probability, we divide each output’s confidence measure by the sum of all confidence scores and this gives a probability for each output image which all add up to 1. Using our Excel example:
This softmax classifier is intuitive. Sherlock thinks there’s a 97% (confidence-weighted) chance that the picture Terminator’s looking at is Elon Musk.
The final step in our model is computing our loss. The loss tells us how good (or bad) of a detective Sherlock really is.
Every neural net has a loss function where we compare predictions to actuals. As we train the CNN, our predictions improve (Sherlock’s detective skills get better) as we adjust the weights/biases of the network.
The most commonly used loss function for CNNs is cross-entropy loss. A Google search on cross-entropy turns up several interpretations with lots of Greek letters so it’s easy to get confused. Despite the varying descriptions, they all mean the same thing in the context of machine learning so we’ll cover the 3 most common below so it will “click” for you.
Before tackling each formula variation, here is what they each do:
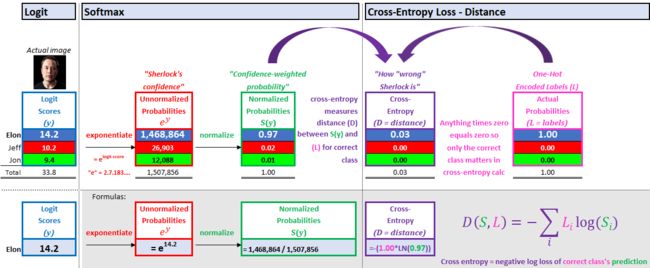
- Compare the probability of the correct class (Elon, 1.00) vs. the CNN’s prediction for Elon (his softmax score, 0.97)
- Reward Sherlock when his prediction for the correct class is close to 1 = low cost ?
- Penalize Sherlock when his prediction for the correct class is close to 0 = high cost ?

These all result in the same answer! 3 different interpretations…
1 Interpretation — A measure of distance between the actual probability and predicted probability
Distance captures the intuition that if our prediction is close to 1 for the correct label, our cost is nearly 0. If our prediction is close to 0 for the correct label, then we are heavily penalized. The goal is to minimize the “distance” between the correct class’s prediction (Elon, 0.97) and the actual probability of the correct class (1.00).
The intuition behind the reward/penalty “log” formula is discussed in interpretation 2
2 Interpretation — Maximizing the log likelihood or minimizing the negative log likelihood
In CNNs, “log” actually means “natural log (ln)” and it is the inverse of the “exponentiation/confidence” done in step 1 of softmax.
Instead of taking the actual probability (1.00) and subtracting the predicted probability (0.97) to calculate cost, the log calculation exponentially penalizes Sherlock the farther away his prediction is from 1.00.
3 Interpretation — KL Divergence
KL (Kullback-Leibler) Divergence measures how much our predicted probability (softmax score) diverges from the actual probability.
The formula is split into 2 parts:
- The amount of uncertainty in our actual probability. In the context of supervised training in machine learning, this is always zero. We are 100% certain our training image is Elon Musk.
- If we use our predicted probability, how many “bits of information” do we lose.
Additional Resources — Interactive
Draw a number and watch the CNN predict it
Train your own CNN with Google + your webcam (or just watch)
Andreij Karpathy’s real-time image classification model
Check out Fast.AI’s YouTube video on CNNs (not interactive, but great lecture and deep learning series)
Translation of the article
