【花式】matlab花风玫瑰图
-
风玫瑰图分为:风向玫瑰图和风速玫瑰图两种。
- 2
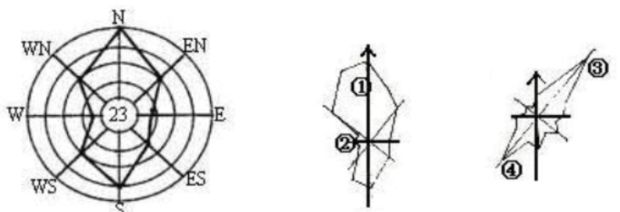
风玫瑰图一般都反映着两个重要信息:风向、风率。
风玫瑰图上所表示的风向即风的来向,是指从外面吹向地区中心的方向
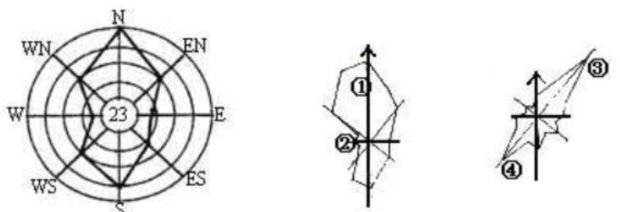
如图:①表示北风,②表示西风,③表示东北风,④表示西南风。
- 3
风向频率:在一定时间内各种风向出现的次数占所有观察次数的百分比。
图中线段最长的,即外面到中心的距离越大,表示风频越大,当地主导风向;
外面到中心的距离越小,表示风频越小,当地最小风频。
如图中①线段最长,为当地的主导风向;②线段最短,为当地的最小风频。
如果当地的主导风向相反,则为季风风向,如图中③④,其主导风向为东北风和西南风。cad转换工具_2021中文版_2021新版下载查看详情>>广告
- 4
风速玫瑰图:
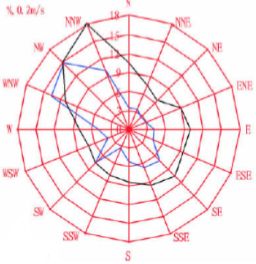
表示各方向的平均风速,其中平均风速用极坐标中的半径表示。
而各个方向风的风速,是以相应的比例长度按风向中心吹,来表达在途中的。
如图。
- 5
同时,建筑物的位置朝向和当地主导风向有密切关系。
把清洁的建筑物布置在主导风向的上风向;把污染建筑布置在主导风向的下风向,最小风频的上方向;污染大气的建筑布局在与季风风向垂直的郊外,以免受污染建筑散发的有害物的影响。
clc; clear; close all;

Options = {'anglenorth',0,... 'The angle in the north is 0 deg (this is the reference from our data, but can be any other)
           'angleeast',90,... 'The angle in the east is 90 deg
           'labels',{'N (0掳)','NE (45掳)','E (90掳)','SE (135掳)','S (180掳)','SW (225掳)','W (270掳)','NW (315掳)'},... 'If you change the reference angles, do not forget to change the labels.
           'freqlabelangle','auto',...
           'legendtype',0,...
           'min_radius',0.25,...
           'titlestring',''};

ax(1) = subplot(1,3,1);
[speed,direction] = WindRandomDistrib(8760,20);
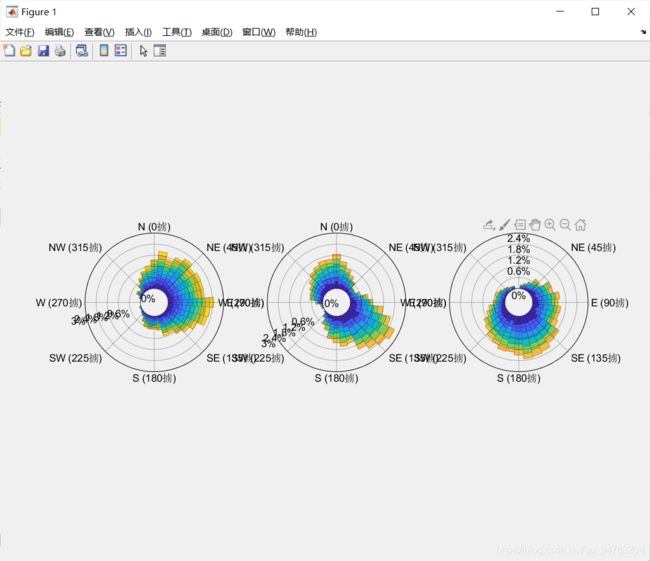
[figure_handle,count,speeds,directions,Table] = WindRose(direction,speed,[Options,{'axes',ax(1)}]);

subplot(1,3,2);
[speed,direction] = WindRandomDistrib(8760,30);
[figure_handle,count,speeds,directions,Table] = WindRose(direction,speed,[Options,{'axes',gca}]);

[speed,direction] = WindRandomDistrib(8760,30);
[figure_handle,count,speeds,directions,Table] = WindRose(direction,speed,[Options,{'axes',subplot(1,3,3)}]);
function [speed,direction] = WindRandomDistrib(N,maxspeed)
if nargin==1
    maxspeed = 20;
end
x     = linspace(0,2*pi,100000);

n = randi([2 10],1);
Y = linspace(0.001,1,n)';
Y = Y(randperm(n));
Y = [Y;Y(1)];
X = linspace(0,2*pi,n+1);

func  = @(x) interp1(X,Y,x,'pchip');

f = cumsum(func(x)*mean(diff(x)));
f = f/max(f);

direction = mod(interp1(f,x,rand(N,1),'spline')*180/pi,360);

% direction = mod(randn(N,1)*2*pi*180/pi,360);

speed = maxspeed*randn(N,1);
while any(speed>maxspeed)
    speed(speed>maxspeed) = 30*randn(sum(speed>maxspeed),1);
end
完整代码或者代写添加QQ1575304183
往期回顾>>>>>>


