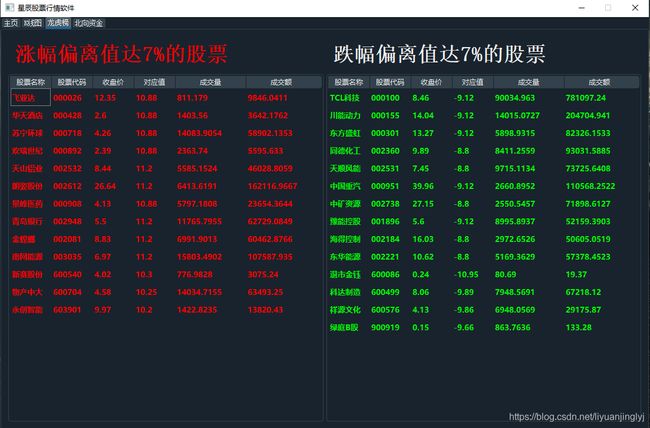
python股票量化交易(14)---使用pyqt5构建股票交易龙虎榜
目录
- 获取龙虎榜数据
- pyqt5显示龙虎榜数据
获取龙虎榜数据
对于股市来说,那些涨幅跌幅都比较大的股票多是游资的聚集地,这些聚集地往往登上龙虎榜的几率非常的高。对于喜欢玩短期的散户来说,尤其喜欢通过该榜单搏一搏的投资者,尤其钟爱龙虎榜。所以,我们可以给我们的交易软件提供一个这样的榜单。
获取免费龙虎榜的方式如下:
df_rise = ak.stock_sina_lhb_detail_daily(trade_date="20210205", symbol="涨幅偏离值达7%的证券")
df_fall = ak.stock_sina_lhb_detail_daily(trade_date="20210205", symbol="跌幅偏离值达7%的证券")
第1个参数如日期,第2个参数为获取的龙虎榜类型。这里,我们的日期都是手动设置的,等我们到后面,通过判断工作日,将其替换掉就行。
pyqt5显示龙虎榜数据
首先,我们需要通过线程获取到龙虎榜的数据,具体代码如下:
import akshare as ak
from PyQt5 import QtCore
from PyQt5.QtCore import pyqtSignal
from pandas import DataFrame


class OtherThread(QtCore.QThread):
    _signalRise = pyqtSignal(DataFrame)
    _signalFall = pyqtSignal(DataFrame)

    def __init__(self):
        super(OtherThread, self).__init__()

    def run(self):
        df_rise = ak.stock_sina_lhb_detail_daily(trade_date="20210205", symbol="涨幅偏离值达7%的证券")
        df_fall = ak.stock_sina_lhb_detail_daily(trade_date="20210205", symbol="跌幅偏离值达7%的证券")
        self._signalRise.emit(df_rise)
        self._signalFall.emit(df_fall)
数据获取完成之后,就可以直接显示到界面上了,main.py的代码如下所示:
class MyFrom(QMainWindow):
	# 龙虎榜
    def init_otherTab(self):
        self.otherGrid = QGridLayout()
        self.otherGrid.setSpacing(5)
        ft = QFont()
        ft.setPointSize(26)
        ft.setBold(True)
        rise_label = QLabel("涨幅偏离值达7%的股票")
        rise_label.setFont(ft)
        rise_label.setStyleSheet("color:red")
        fall_label = QLabel("跌幅偏离值达7%的股票")
        fall_label.setFont(ft)
        self.otherGrid.addWidget(rise_label, 0, 0, 1, 8)
        self.otherGrid.addWidget(fall_label, 0, 8, 1, 8)
        self.otherTab.setLayout(self.otherGrid)
        self.otherThread = OtherThread()
        self.otherThread._signalRise.connect(self.otherRise_callbacklog)
        self.otherThread._signalFall.connect(self.otherFall_callbacklog)
        self.otherThread.start()

    def otherFall_callbacklog(self, df):
        ft = QFont()
        ft.setPointSize(10)
        ft.setBold(True)
        m_color = QColor(0, 255, 0)
        otherFalltableWidget = QTableWidget(len(df), 6)
        otherFalltableWidget.setHorizontalHeaderLabels(['股票名称', '股票代码', '收盘价', "对应值", "成交量", "成交额"])
        otherFalltableWidget.setEditTriggers(QAbstractItemView.NoEditTriggers)  # 不可编辑
        otherFalltableWidget.horizontalHeader().setSectionResizeMode(QHeaderView.Fixed)  # 禁止拖拽
        otherFalltableWidget.setSelectionBehavior(QAbstractItemView.SelectRows)  # 只能选中一行
        otherFalltableWidget.itemClicked.connect(self.tableWidget_connect)
        otherFalltableWidget.verticalHeader().setVisible(False)
        otherFalltableWidget.setShowGrid(False)  # 不显示子线条
        otherFalltableWidget.setColumnWidth(0, 70)  # 设置第一列宽
        otherFalltableWidget.setColumnWidth(1, 70)  # 设置第二列宽
        otherFalltableWidget.setColumnWidth(2, 70)  # 设置第三列宽
        otherFalltableWidget.setColumnWidth(3, 70)  # 设置第三列宽
        otherFalltableWidget.setColumnWidth(4, 120)  # 设置第三列宽
        otherFalltableWidget.setColumnWidth(5, 120)  # 设置第三列宽
        for idx, row in df.iterrows():
            newItem0 = QTableWidgetItem(str(row["股票名称"]))
            newItem0.setFont(ft)
            newItem0.setForeground(QBrush(m_color))
            newItem1 = QTableWidgetItem(str(row["股票代码"]))
            newItem1.setFont(ft)
            newItem1.setForeground(QBrush(m_color))
            newItem2 = QTableWidgetItem(str(row["收盘价"]))
            newItem2.setFont(ft)
            newItem2.setForeground(QBrush(m_color))
            newItem3 = QTableWidgetItem(str(row["对应值"]))
            newItem3.setFont(ft)
            newItem3.setForeground(QBrush(m_color))
            newItem4 = QTableWidgetItem(str(row["成交量"]))
            newItem4.setFont(ft)
            newItem4.setForeground(QBrush(m_color))
            newItem5 = QTableWidgetItem(str(row["成交额"]))
            newItem5.setFont(ft)
            newItem5.setForeground(QBrush(m_color))
            otherFalltableWidget.setItem(idx, 0, newItem0)
            otherFalltableWidget.setItem(idx, 1, newItem1)
            otherFalltableWidget.setItem(idx, 2, newItem2)
            otherFalltableWidget.setItem(idx, 3, newItem3)
            otherFalltableWidget.setItem(idx, 4, newItem4)
            otherFalltableWidget.setItem(idx, 5, newItem5)
        self.otherGrid.addWidget(otherFalltableWidget, 1, 8, 10, 8)

    def otherRise_callbacklog(self, df):
        ft = QFont()
        ft.setPointSize(10)
        ft.setBold(True)
        m_color = QColor(255, 0, 0)
        otherRisetableWidget = QTableWidget(len(df), 6)
        otherRisetableWidget.setHorizontalHeaderLabels(['股票名称', '股票代码', '收盘价', "对应值", "成交量", "成交额"])
        otherRisetableWidget.setEditTriggers(QAbstractItemView.NoEditTriggers)  # 不可编辑
        otherRisetableWidget.horizontalHeader().setSectionResizeMode(QHeaderView.Fixed)  # 禁止拖拽
        otherRisetableWidget.setSelectionBehavior(QAbstractItemView.SelectRows)  # 只能选中一行
        otherRisetableWidget.itemClicked.connect(self.tableWidget_connect)
        otherRisetableWidget.verticalHeader().setVisible(False)
        otherRisetableWidget.setShowGrid(False)  # 不显示子线条
        otherRisetableWidget.setColumnWidth(0, 70)  # 设置第一列宽
        otherRisetableWidget.setColumnWidth(1, 70)  # 设置第二列宽
        otherRisetableWidget.setColumnWidth(2, 70)  # 设置第三列宽
        otherRisetableWidget.setColumnWidth(3, 70)  # 设置第三列宽
        otherRisetableWidget.setColumnWidth(4, 120)  # 设置第三列宽
        otherRisetableWidget.setColumnWidth(5, 120)  # 设置第三列宽
        for idx, row in df.iterrows():
            newItem0 = QTableWidgetItem(str(row["股票名称"]))
            newItem0.setFont(ft)
            newItem0.setForeground(QBrush(m_color))
            newItem1 = QTableWidgetItem(str(row["股票代码"]))
            newItem1.setFont(ft)
            newItem1.setForeground(QBrush(m_color))
            newItem2 = QTableWidgetItem(str(row["收盘价"]))
            newItem2.setFont(ft)
            newItem2.setForeground(QBrush(m_color))
            newItem3 = QTableWidgetItem(str(row["对应值"]))
            newItem3.setFont(ft)
            newItem3.setForeground(QBrush(m_color))
            newItem4 = QTableWidgetItem(str(row["成交量"]))
            newItem4.setFont(ft)
            newItem4.setForeground(QBrush(m_color))
            newItem5 = QTableWidgetItem(str(row["成交额"]))
            newItem5.setFont(ft)
            newItem5.setForeground(QBrush(m_color))
            otherRisetableWidget.setItem(idx, 0, newItem0)
            otherRisetableWidget.setItem(idx, 1, newItem1)
            otherRisetableWidget.setItem(idx, 2, newItem2)
            otherRisetableWidget.setItem(idx, 3, newItem3)
            otherRisetableWidget.setItem(idx, 4, newItem4)
            otherRisetableWidget.setItem(idx, 5, newItem5)
        self.otherGrid.addWidget(otherRisetableWidget, 1, 0, 10, 8)
这里,博主为了偷懒,没有使用for循环生成pyqt5的控件。感兴趣的可以模仿量化交易第11篇,使用for循环生成QLabel的方式生成QTableWidgetItem。
