Python 机器学习 PCA
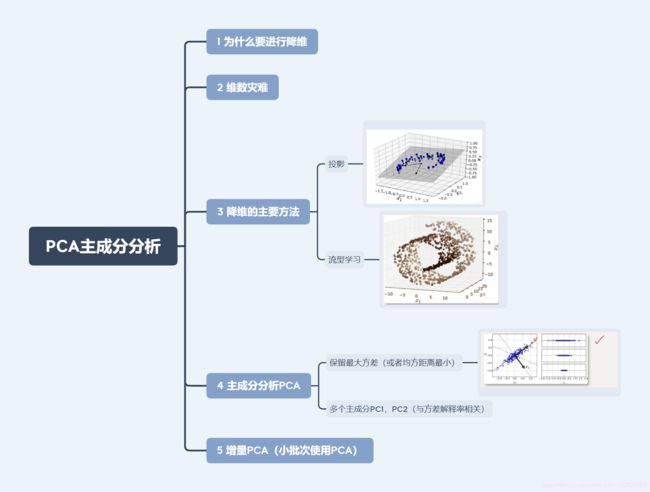
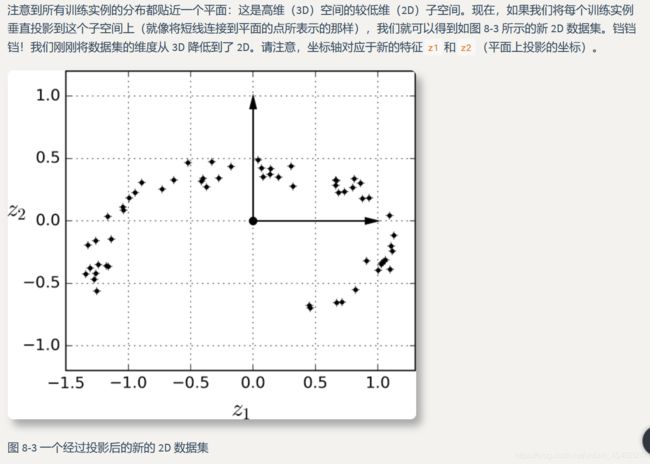
这2张图实现:
from __future__ import division, print_function, unicode_literals

import numpy as np
import os

# to make this notebook's output stable across runs
np.random.seed(42)

# To plot pretty figures
%matplotlib inline
import matplotlib as mpl
import matplotlib.pyplot as plt
mpl.rc('axes', labelsize=14)
mpl.rc('xtick', labelsize=12)
mpl.rc('ytick', labelsize=12)

# Where to save the figures  #保存图片位置
PROJECT_ROOT_DIR = "."
CHAPTER_ID = "unsupervised_learning"

def save_fig(fig_id, tight_layout=True):
    path = os.path.join(PROJECT_ROOT_DIR, "images", CHAPTER_ID, fig_id + ".png")
    print("Saving figure", fig_id)
    if tight_layout:
        plt.tight_layout()
    plt.savefig(path, format='png', dpi=300)

# Ignore useless warnings (see SciPy issue #5998)
import warnings
warnings.filterwarnings(action="ignore", message="^internal gelsd")
#画图函数
np.random.seed(4)
m = 60
w1, w2 = 0.1, 0.3
noise = 0.1

angles = np.random.rand(m) * 3 * np.pi / 2 - 0.5

X = np.empty((m, 3))  #生成60*3
X[:, 0] = np.cos(angles) + np.sin(angles)/2 + noise * np.random.randn(m) / 2  #生成3维数据
X[:, 1] = np.sin(angles) * 0.7 + noise * np.random.randn(m) / 2
X[:, 2] = X[:, 0] * w1 + X[:, 1] * w2 + noise * np.random.randn(m)
#构建数据
#PCA  use sklearn
from sklearn.decomposition import PCA

pca = PCA(n_components = 2)
X2D = pca.fit_transform(X)
X3D_inv = pca.inverse_transform(X2D)
X3D_inv_using_svd = X2D_using_svd.dot(Vt[:2, :])
from matplotlib.patches import FancyArrowPatch
from mpl_toolkits.mplot3d import proj3d


class Arrow3D(FancyArrowPatch):#类
    def __init__(self, xs, ys, zs, *args, **kwargs):
        FancyArrowPatch.__init__(self, (0,0), (0,0), *args, **kwargs)
        self._verts3d = xs, ys, zs

    def draw(self, renderer):#画图的函数
        xs3d, ys3d, zs3d = self._verts3d
        xs, ys, zs = proj3d.proj_transform(xs3d, ys3d, zs3d, renderer.M)
        self.set_positions((xs[0],ys[0]),(xs[1],ys[1]))
        FancyArrowPatch.draw(self, renderer)
axes = [-1.8, 1.8, -1.3, 1.3, -1.0, 1.0]

x1s = np.linspace(axes[0], axes[1], 10)
x2s = np.linspace(axes[2], axes[3], 10)
x1, x2 = np.meshgrid(x1s, x2s)

C = pca.components_
R = C.T.dot(C)
z = (R[0, 2] * x1 + R[1, 2] * x2) / (1 - R[2, 2])
#获取投影的平面
from mpl_toolkits.mplot3d import Axes3D

fig = plt.figure(figsize=(6, 3.8))
ax = fig.add_subplot(111, projection='3d')

X3D_above = X[X[:, 2] > X3D_inv[:, 2]]
X3D_below = X[X[:, 2] <= X3D_inv[:, 2]]

ax.plot(X3D_below[:, 0], X3D_below[:, 1], X3D_below[:, 2], "bo", alpha=0.5)

ax.plot_surface(x1, x2, z, alpha=0.2, color="k")#画投影的平面
np.linalg.norm(C, axis=0)
ax.add_artist(Arrow3D([0, C[0, 0]],[0, C[0, 1]],[0, C[0, 2]], mutation_scale=15, lw=1, arrowstyle="-|>", color="k"))
ax.add_artist(Arrow3D([0, C[1, 0]],[0, C[1, 1]],[0, C[1, 2]], mutation_scale=15, lw=1, arrowstyle="-|>", color="k"))
ax.plot([0], [0], [0], "k.")

for i in range(m):
    if X[i, 2] > X3D_inv[i, 2]:
        ax.plot([X[i][0], X3D_inv[i][0]], [X[i][1], X3D_inv[i][1]], [X[i][2], X3D_inv[i][2]], "k-")
    else:
        ax.plot([X[i][0], X3D_inv[i][0]], [X[i][1], X3D_inv[i][1]], [X[i][2], X3D_inv[i][2]], "k-", color="#505050")

ax.plot(X3D_inv[:, 0], X3D_inv[:, 1], X3D_inv[:, 2], "k+")#投影
ax.plot(X3D_inv[:, 0], X3D_inv[:, 1], X3D_inv[:, 2], "k.")
ax.plot(X3D_above[:, 0], X3D_above[:, 1], X3D_above[:, 2], "bo")
ax.set_xlabel("$x_1$", fontsize=18)
ax.set_ylabel("$x_2$", fontsize=18)
ax.set_zlabel("$x_3$", fontsize=18)
ax.set_xlim(axes[0:2])
ax.set_ylim(axes[2:4])
ax.set_zlim(axes[4:6])

plt.show()
fig = plt.figure()
ax = fig.add_subplot(111, aspect='equal')

ax.plot(X2D[:, 0], X2D[:, 1], "k+")
ax.plot(X2D[:, 0], X2D[:, 1], "k.")
ax.plot([0], [0], "ko")
ax.arrow(0, 0, 0, 1, head_width=0.05, length_includes_head=True, head_length=0.1, fc='k', ec='k')
ax.arrow(0, 0, 1, 0, head_width=0.05, length_includes_head=True, head_length=0.1, fc='k', ec='k')
ax.set_xlabel("$z_1$", fontsize=18)
ax.set_ylabel("$z_2$", fontsize=18, rotation=0)
ax.axis([-1.5, 1.3, -1.2, 1.2])
ax.grid(True)
save_fig("dataset_2d_plot")
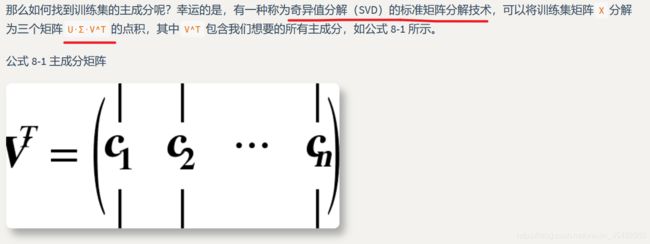
X_centered=X-X.mean(axis=0)
U,s,V=np.linalg.svd(X_centered)
c1=V.T[:,0]
c2=V.T[:,1]
