OpenCV-Python学习之路-6:Image Thresholding(图像阈值)
文章目录
-
- 参考依据
- 目标
- Simple Thresholding 简单阈值
- Adaptive Thresholding 自适应阈值
- Otsu's Binarization 大津二值化
参考依据
官方文档:
https://opencv-python-tutroals.readthedocs.io/en/latest/py_tutorials/py_imgproc/py_thresholding/py_thresholding.html
目标
- 学习简单的阈值处理、自适应阈值处理、大津阈值处理等
- 将学到cv2.threshold(),cv2.adaptiveThreshold()等函数
Simple Thresholding 简单阈值
简单地对图像所有像素点设阈值,主要用到的函数为:cv2.threshold(),关于这个函数,我之前在一个博客中已经介绍 过了,大家可以点击下面的链接进行学习:
OpenCV-Python: 图像二值化/去噪 cv2.threshold()、cv2.inRange()函数详解
Adaptive Thresholding 自适应阈值
简单地设置一个全局阈值,很多时候并不能很好地解决问题,特别是对于那些光照变化比较大的图像(同一图像中不同区域的光照变化较大)效果很不好。因此,可以对不同区域自适应地设置不同的阈值。
cv2.adaptiveThreshold(src, maxValue, adaptiveMethod, thresholdType, blockSize, C)
返回值:dst 处理后的图像
参数:

- src:输入图像
- maxValue:条件满足时所设置的值,详细见下文
- adaptiveMethod:所使用的自适应阈值选取算法,ADAPTIVE_THRESH_MEAN_C 或者 ADAPTIVE_THRESH_GAUSSIAN_C
- thresholdType:只有THRESH_BINARY 和 THRESH_BINARY_INV两种
- blockSize:像素邻域的大小,用于计算像素的阈值,例如3,5,7等等
- C:从平均值或加权平均值中减去常数(请参见下面的详细信息),可以为正,0,也可以为负数。
函数主要根据以下公式将灰度图像转换为二值图像:

T(x,y)即为阈值的计算方式:
- ADAPTIVE_THRESH_MEAN_C:以(x,y)中心,blockSize*blockSize区域中所有像素的平均值,再减去C,作为阈值T(x,y)。
- ADAPTIVE_THRESH_GAUSSIAN_C:阈值T(x,y)是邻域中像素值的加权总和,再减去C,其中权重参数为高斯窗口。
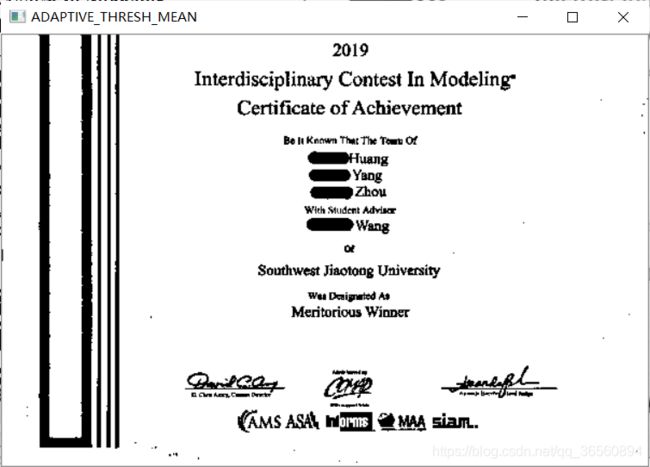
img = cv2.resize(cv2.imread('0002.jpg'), (600, 400))
img2gray = cv2.cvtColor(img, cv2.COLOR_BGR2GRAY)

_, th1 = cv2.threshold(img2gray, 220, 255, cv2.THRESH_BINARY)
th2 = cv2.adaptiveThreshold(img2gray, 255, cv2.ADAPTIVE_THRESH_MEAN_C, cv2.THRESH_BINARY, 21, 8)
th3 = cv2.adaptiveThreshold(img2gray, 255, cv2.ADAPTIVE_THRESH_GAUSSIAN_C, cv2.THRESH_BINARY, 21, 8)

cv2.imshow('Origin', img2gray)
cv2.imshow('threshold', th1)
cv2.imshow('ADAPTIVE_THRESH_MEAN', th2)
cv2.imshow('ADAPTIVE_THRESH_GAUSSIAN', th3)
if cv2.waitKey(0) & 0xFF == ord('q'):
    cv2.destroyAllWindows()
Otsu’s Binarization 大津二值化
在cv2.thershold()中,会返回两个值,一个是dst,为处理后的结果,一个是retVal,返回阈值。在我们使用大津二值化算法时就可以通过返回的retVal查看其设置的阈值。
在使用cv2.threshold()时,通常我们怎么去判断阈值选取的好坏呢?只有通过不断的实验。但对于一些双峰图像(Bimodal image,简单来说就是图像的直方图有两个峰即为双峰图像) 来说,选取两峰之间的某个值效果就会不错,这恰恰就是Otus算法所做的工作。简单地说,它可以自动对双峰图像求取合适的阈值,如果图像本身就不为双峰图像,那么二值化的结果是不准确的。
那么如何使用大津二值化呢,只需要在使用cv2.threshold()函数的时候,传入额外的flag参数,对于Threshold参数,传入0即可。算法会自动找到最优阈值,可通过返回的retVal参数查看。
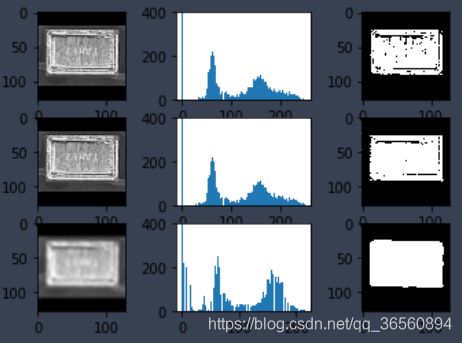
下面为一个简单阈值和大津算法的对比示例,通常为了更好地消除图像噪声的干扰以及构造双峰图像,我们会先对图像进行一个滤波操作,下图为高斯滤波过程。
img = cv2.imread('0003.png')
img2gray = cv2.cvtColor(img, cv2.COLOR_BGR2GRAY)

# 简单阈值 127
_, th1 = cv2.threshold(img2gray, 127, 255, cv2.THRESH_BINARY)
plt.subplot(3,3,1), plt.imshow(img2gray, 'gray')
plt.subplot(3,3,2), plt.hist(img2gray.ravel(), 256)
axes = plt.gca()
axes.set_ylim([0,400])
plt.subplot(3,3,3), plt.imshow(th1, 'gray')

# 大津二值化
_, th2 = cv2.threshold(img2gray, 0, 255, cv2.THRESH_BINARY+cv2.THRESH_OTSU)
plt.subplot(3,3,4), plt.imshow(img2gray, 'gray')
plt.subplot(3,3,5), plt.hist(img2gray.ravel(), 256)
axes = plt.gca()
axes.set_ylim([0,400])
plt.subplot(3,3,6), plt.imshow(th2, 'gray')

# 高斯滤波 + 大津二值化
blur = cv2.GaussianBlur(img2gray, (11,11), 0)
_, th3 = cv2.threshold(blur, 0, 255, cv2.THRESH_BINARY+cv2.THRESH_OTSU)
plt.subplot(3,3,7), plt.imshow(blur, 'gray')
plt.subplot(3,3,8), plt.hist(blur.ravel(), 256)
axes = plt.gca()
axes.set_ylim([0,400])
plt.subplot(3,3,9), plt.imshow(th3, 'gray')

plt.show()


